
Over the past few centuries, widespread disturbance of native forests of the conterminous United States has dramatically altered the composition, structure, extent, and spatial pattern of forestlands (Curtis 1956, Whitney 1994). These forests have been either permanently replaced by other land uses or degraded to varying degrees by unsustainable forestry practices, forest fragmentation, exotic species introduction, or alteration of natural disturbance regimes.
Habitat fragmentation is generally defined as the process of subdividing a continuous habitat type into smaller patches, which results in the loss of original habitat, reduction in patch size, and increasing isolation of patches (Andrén 1994). Habitat fragmentation is considered to be one of the single most important factors leading to loss of native species (especially in forested landscapes) and one of the primary causes of the present extinction crisis (Wilcox and Murphy 1985). Although it is true that natural disturbances such as fire and disease fragment native forests, human activities are by far the most extensive agents of forest fragmentation (Burgess and Sharpe 1981). For example, during a 20-year period in the Klamath–Siskiyou ecoregion, fire was responsible for 6% of forest loss, while clear-cut logging was responsible for 94% (Staus et al. 2001). Depending on the severity of the fragmentation process and sensitivity of the ecosystems affected, native plants, animals, and many natural ecosystem processes (e.g., nutrient cycling, pollination, predator–prey interactions, and natural disturbance regimes) are compromised or fundamentally altered. For many species, migration between suitable habitat patches becomes more difficult, leading to smaller population sizes, decreased gene flow, and possible local extinctions (Wilcove 1987, Vermeulen 1993).
Models are commonly used to identify lands that will best maintain the ability of wildlife to move between wildland blocks through matrix lands after the remaining matrix has become incompatible with wildlife movement. We offer a roadmap of 16 choices and assumptions that arise in designing linkages to facilitate movement or gene flow of focal species between 2 or more predefined wildland blocks. We recommend designing linkages to serve multiple (rather than one) focal species likely to serve as a collective umbrella for all native species and ecological processes, explicitly acknowledging untested assumptions, and using uncertainty analysis to illustrate potential effects of model uncertainty. Such uncertainty is best displayed to stakeholders as maps of modeled linkages under different assumptions. We also recommend modeling corridor dwellers (species that require more than one generation to move their genes between wildland blocks) differently from passage species (for which an individual can move between wildland blocks within a few weeks). We identify a problem, which we call the subjective translation problem, that arises because the analyst must subjectively decide how to translate measurements of resource selection into resistance. This problem can be overcome by estimating resistance from observations of animal movement, genetic distances, or interpatch movements. There is room for substantial improvement in the procedures used to design linkages robust to climate change and in tools that allow stakeholders to compare an optimal linkage design to alternative designs that minimize costs or achieve other conservation goals.
The geographic genetic structure, based on sequence variation of an 810 base pair fragment of the mitochondrial cytochrome b gene, is described for populations of five subspecies of the Little Pocket Mouse, Perognathus longimembris, from Southern California. One of these, P. l. pacificus (Pacific Pocket Mouse), is listed as Endangered by the U.S. Federal Government. Sixty-two unique haplotypes were recovered from 99 individuals sampled. Phylogenetic analyses of these variants do not identify regionally reciprocally monophyletic lineages concordant with the current subspecies designations, but most haplotypes group by subspecies in networks generated by either statistical parsimony or molecular variance parsimony.Moreover, a substantial proportion of the total pool of haplotype variation is attributed to these subspecies, or to local populations within geographic segments of each, indicating their relative evolutionary independence. The pooled extant populations of the endangered Pacific Pocket Mouse exhibit the same levels of nucleotide and haplotype diversity as other, presumptively less-impacted populations of adjacent subspecies, although the sample from Dana Point, Orange County, has markedly low haplotype diversity in comparison to all others. These populations also show a genetic signature of population expansion rather than one of decline. Both pieces of evidence are at odds with current empirical population estimates, which reinforces the fact that present-day patterns of genetic diversity are the product of coalescent history and will not necessarily reflect recent anthropogenic, or other, perturbations. Comparison of haplotype variation within and among extant populations of the Pacific Pocket Mouse with those obtained from museum samples collected more than 70 years ago suggests that the pattern of population differentiation and diversity was in place before the post-WorldWar II exponential urbanization of Southern California.
The conversion of natural habitat to urban settlements is a primary driver of biodiversity loss, and species’ persistence is threatened by the extent, location, and spatial pattern of development. Urban growth models are widely used to anticipate future development and to inform conservation management, but the source of spatial input to these models may contribute to uncertainty in their predictions. We compared two sources of historic urban maps, used as input for model calibration, to determine how differences in definition and scale of urban extent affect the resulting spatial predictions from a widely used urban growth model for San Diego County, CA under three conservation scenarios. The results showed that rate, extent, and spatial pattern of predicted urban development, and associated habitat loss, may vary substantially depending on the source of input data, regardless of how much land is excluded from development. Although the datasets we compared both represented urban land, different types of land use/land cover included in the definition of urban land and different minimum mapping units contributed to the discrepancies. Varying temporal resolution of the input datasets also contributed to differences in projected rates of development. Differential predicted impacts to vegetation types illustrate how the choice of spatial input data may lead to different conclusions relative to conservation. Although the study cannot reveal whether one dataset is better than another, modelers should carefully consider that geographical reality can be represented differently, and should carefully choose the definition and scale of their data to fit their research objectives.
Questions: To what extent do plant species traits, including life history, life form, and disturbance response characteristics, affect the degree to which species distributions are determined by physical environmental factors? Is the strength of the relationship between species distribution and environment stronger in some disturbance-response types than in others?
Location: California southwest ecoregion, USA.
Methods: We developed species distribution models (SDMs) for 45 plant species using three primary modeling methods (GLMs, GAMs, and Random Forests). Using AUC as a performance measure of prediction accuracy, and measure of the strength of species–environment correlations, we used regression analyses to compare the effects of fire disturbance response type, longevity, dispersal mechanism, range size, cover, species prevalence, and model type.
Results: Fire disturbance response type explained more variation in model performance than any other variable, but other species and range characteristics were also significant. Differences in prediction accuracy reflected variation in species life history, disturbance response, and rarity. AUC was significantly higher for longer-lived species, found at intermediate levels of abundance, and smaller range sizes. Models performed better for shrubs than sub-shrubs and perennial herbs. The disturbance response type with the highest SDM accuracy was obligate-seeding shrubs with ballistic dispersal that regenerate via fire-cued germination from a dormant seed bank.
Conclusions: The effect of species characteristics on predictability of species distributions overrides any differences in modeling technique. Prediction accuracy may be related to how a suite of species characteristics co-varies along environmental gradients. Including disturbance response was important because SDMs predict the realized niche. Classification of plant species into disturbance response types may provide a strong framework for evaluating performance of SDMs.
Prediction maps produced by species distribution models (SDMs) influence decision-making in resource management or designation of land in conservation planning. Many studies have compared the prediction accuracy of different SDM modeling methods, but few have quantified the similarity among prediction maps. There has also been little systematic exploration of how the relative importance of different predictor variables varies among model types and affects map similarity. Our objective was to expand the evaluation of SDM performance for 45 plant species in southern California to better understand how map predictions vary among model types, and to explain what factors may affect spatial correspondence, including the selection and relative importance of different environmental variables. Four types of models were tested. Correlation among maps was highest between generalized linear models (GLMs) and generalized additive models (GAMs) and lowest between classification trees and GAMs or GLMs. Correlation between Random Forests (RFs) and GAMs was the same as between RFs and classification trees. Spatial correspondence among maps was influenced the most by model prediction accuracy (AUC) and species prevalence; map correspondence was highest when accuracy was high and prevalence was intermediate (average prevalence for all species was 0.124). Species functional type and the selection of climate variables also influenced map correspondence. For most (but not all) species, climate variables were more important than terrain or soil in predicting their distributions. Environmental variable selection varied according to modeling method, but the largest differences were between RFs and GLMs or GAMs. Although prediction accuracy was equal for GLMs, GAMs, and RFs, the differences in spatial predictions suggest that it may be important to evaluate the results of more than one model to estimate the range of spatial uncertainty before making planning decisions based on map outputs. This may be particularly important if models have low accuracy or if species prevalence is not intermediate.
Greehouse gas emissions have significantly altered global climate, and will continue to do so in the future. Increases in the frequency, duration, and/or severity of drought and heat stress associated with climate change could fundamentally alter the composition, structure, and biogeography of forests in many regions. Of particular concern are potential increases in tree mortality associated with climate-induced physiological stress and interactions with other climate-mediated processes such as insect outbreaks and wildfire. Despite the risk, existing projections of tree mortality are based on models that lack functionally realitic mortality mechanisms, and there has been no attempt to track observations of climate-driven tree mortality globally. Here we present the first global assessment of recent tree mortality attributed to drought and heat stress. Although episodic mortality occurs in the absense of climate change, studies compiled here suggest that at least some of the world’s forested ecosystems already may be responding to climate change and raise concern that forests may become increasingly vulnerable to higher background tree mortality rates and die-off in response to future warming and drought, even in environments that are not normally considered water-limited. This further suggests risk to ecosystem services, including the loss of sequestered forest carbon and associated atmospheric feedbacks. Our review also identifies key information gaps and scientific uncertainties that currently hinder our ability to predict tree mortality in response to climate change and emphasize the need for a globally coordinated observation system. Overall, our review reveals the potential for amplified tree mortality due to drought and heat in forests worldwide.
This paper represents a collaboration by conservation practitioners, ecologists, and climate change scientists to provide specific guidance on local and regional adaptation strategies to climate change for conservation planning and restoration activities. Our geographic focus is the Willamette Valley-Puget Trough-Georgia Basin (WPG) ecoregion, comprised of valley lowlands formerly dominated by now-threatened prairies and oak savannas. We review climate model strengths and limitations, and summarize climate change projections and potential impacts on WPG prairies and oak savannas. We identify a set of six climate-smart strategies that do not require abandoning past management approaches but rather reorienting them towards a dynamic and uncertain future. These strategies focus on linking local and regional landscape characteristics to the emerging needs of species, including potentially novel species assemblages, so that prairies and savannas are maintained in locations and conditions that remain well-suited to their persistence. At the regional scale, planning should use the full range of biological and environmental variability. At the local scale, habitat heterogeneity can be used to support species persistence by identifying key refugia. Climate change may marginalize sites currently used for agriculture and forestry, which may become good candidates for restoration. Native grasslands may increasingly provide ecosystem services that may support broader societal needs exacerbated by climate change. Judicious monitoring can help identify biological thresholds and restoration opportunities. To prepare for both future challenges and opportunities brought about by climate change, land managers must incorporate climate change projections and uncertainties into their long-term planning.
CBI developed and applied a forest management decision-support system (DSS) for forest resilience planning in the southern Sierra Nevada that integrates the latest science on how vegetation, terrain, climate, and weather interact to influence fire risks and forest resilience. The interdisciplinary team led by CBI includes ecological modelers, forest ecologists, fire scientists, physicists, and statisticians. The core of the DSS will be a Forest Resilience Model built using EEMS (Ecosystem Evaluation Modeling System; Sheehan and Gough 2016). The DSS was tested, refined, and applied to resilience planning in that portion of the modeling region of greatest concern to the interagency Sequoia Regional Partnership, which is working to restore ecologically resilient conditions in and near Sequoia National Forest and Sequoia-Kings Canyon National Park.
This project addressed the need for regionally-relevant forest management decision support tools by developing new models and maps of severe wildfire risk and drought-related tree mortality in the southern Sierra Nevada. The models include multivariate statistical models of drought and fire risks, and transparent modular models using the fuzzy-logic modeling system, EEMS (Ecosystem Evaluation Modeling System (Sheehan and Gough 2016)). The statistical models used the best variables and data available at the time of the project to provide recent snapshots of forest conditions and were used to inform development of the updateable EEMS models to be used in decision-making. The EEMS models of forest resilience rely on variables and datasets that can be updated to reflect environmental change.
This project also developed a method of using statewide forest structure data from the California Forest Observatory (CFO) (California Forest Observatory 2020)) to calculate vegetation-created wind-drag at 10m horizontal and 1m vertical resolution based on how trees, shrubs, and ground cover affect winds below, within, and above forest canopies. These vegetation-based wind-drag coefficients can be used to calculate how oxygen flow to fires is affected by forest structure and thus affects fire behavior. Changes in forest structure, for example due to fires or fuels treatments, may affect fire behavior and the likelihood of extreme wildfire behavior induced by atmosphere-fire coupling (Coen et al. 2020). Because CFO data are California-wide and were expected to be annually updated, wind-drag maps could be updated annually and used to guide fuel-treatment priorities. These results can be immediately applied to improving assessment of the effects and effectiveness of fuels treatments using operational fire models, which to date have not accounted for how reducing fuels also increases ventilation (e.g., FlamMap 6.2). Although the scientific consensus has been that fuels treatments reduce fire intensity within the treatment footprint, it is essential to understand and quantify how they may also increase ventilation into neighboring areas, and hence potentially increase fire risks in unintended ways.
The DSS will be further refined and applied to resilience planning by the Sequoia Regional Partnership, whose primary focus is reducing fire risks to giant sequoia groves, fishers, and human communities.
External Team members include: Joe Werne (NorthWest Research Associates NWRA), Christopher Wikle (Department of Statistics, University of Missouri) and David Marvin (SALO Science).
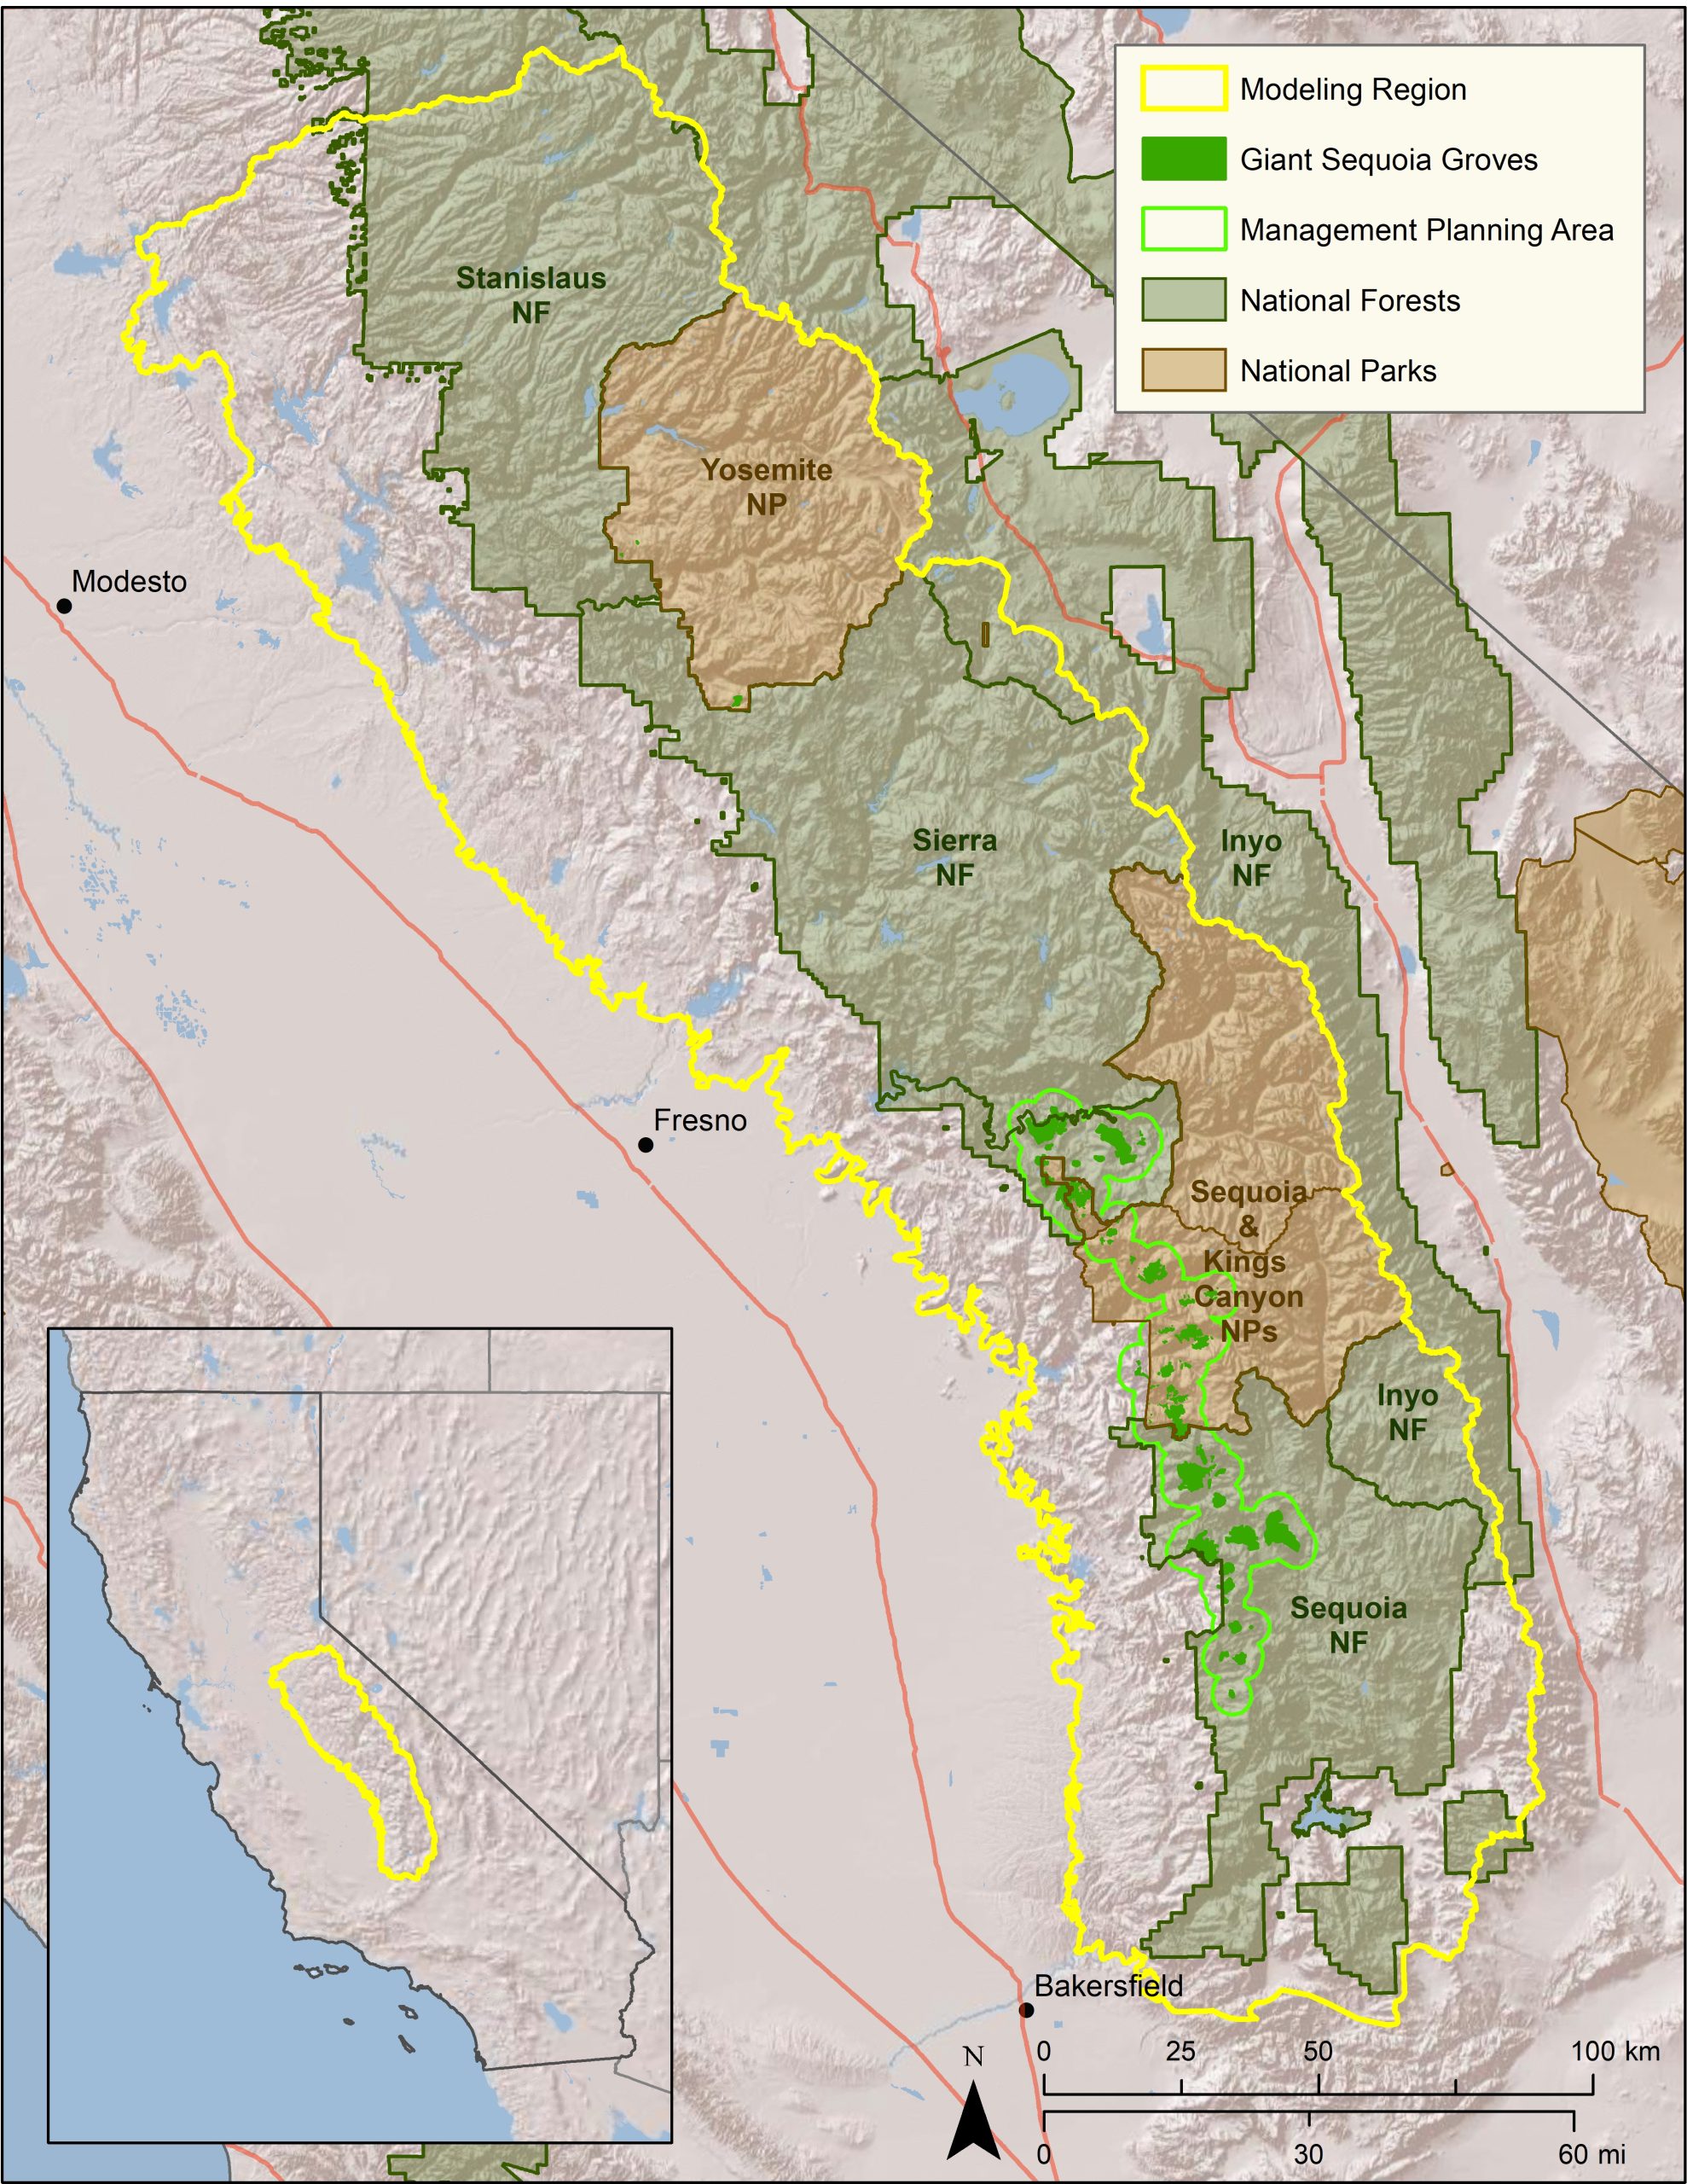 Map of project study area.
The Forest Treatment Planner was developed to provide forest managers a platform for exploring the potential consequences of different forest management alternatives in both the short and long-term, examine the resource-based trade-offs inherent in any proposed vegetation management action, and clearly substantiate the rationale behind management planning. Originally envisioned as a means to help balance fisher habitat conservation with fuel reduction efforts, the Treatment Planner provides a dynamic link between GIS, the Forest Vegetation Simulator (FVS) modeling software, and any resource model (e.g. habitat, hydrology, fuel, economic) that uses the EEMS (Environmental Evaluation Modeling System) modeling environment. As such, the Treatment Planner is not a model per-se, but a system of communication between existing software that, when used together, can facilitate spatially-explicit comparisons and project refinement. By exporting an FVS output directly into the EEMS modeling environment, this framework allows for a transparent evaluation of the impacts to multiple resource values and a straightforward process for communicating these impacts to stakeholders.
The Treatment Planner supports an iterative process of treatment project simulation, adaptive management, and outcomes analysis, the steps in what we refer to as the “4-Box” decision making framework. The 4-Box model is a conceptual representation of a process designed to help predict future landscape conditions based on simulated management actions and change over time (see Figure). In this process, the forest manager first examines the current conditions of the landscape through the lens of a particular question or management objective (e.g., where is there a need for protection or restoration?). They can then explore the predicted effects of various simulated management alternatives (e.g., thin from above, or thin from below), to see how they would affect the stand structure (e.g., stand density, basal area, and average DBH) over time, both immediately and into the future. Finally, the manager can examine how those new conditions would then affect a particular phenomenon of interest such as, severe fire risk, or wildlife habitat suitability. This process is then repeated under a different set of treatment options (scenarios) to inform the development of an effective management strategy.
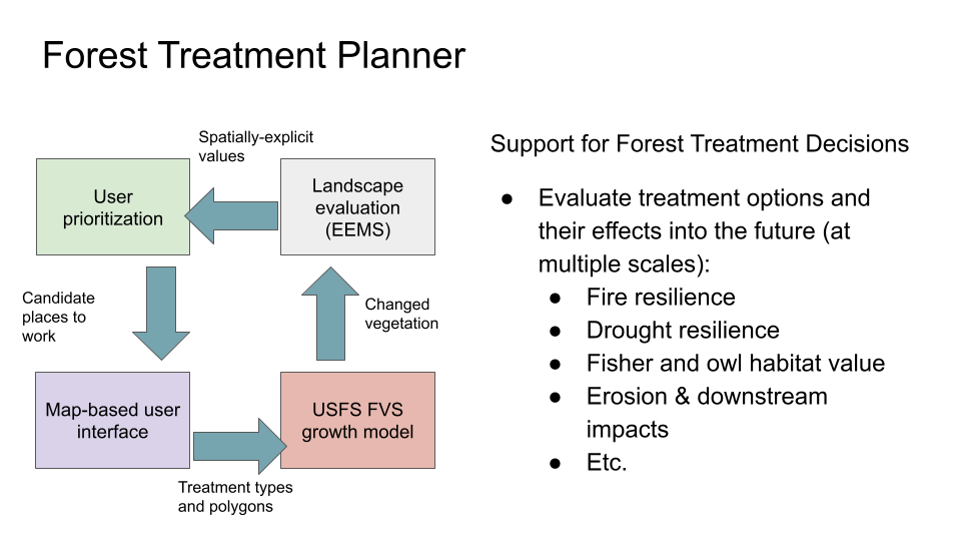
Figure 1. The 4-Box model represents a process for evaluating future conditions based on simulated treatments and change over time.
You can check out the detailed steps to use the treatment planner using the document on the file tab. The relevant code for the treatment planner is available at github, click here to download.