In collaboration with Picea, Inc., the Conservation Biology Institute (CBI) conducted a comprehensive natural resource inventory for the Squaxin Island Tribe, located in western Washington at the southern extent of Puget Sound. The inventory focused on local and regional forest resources, emphasizing forest composition and age structure within both tribal lands and the surrounding region.
Using the Data Basin platform, approximately 200 relevant spatial datasets were curated and organized within a secure, private group space accessible to tribal members. As part of the analysis, a land cover update was performed, and forest condition profiles were developed by ownership type—with special attention to tribal lands—and by subwatershed.
The assessment revealed a wide range of forest conditions across the landscape. The resulting inventory is intended to serve as a dynamic, “living” resource, enabling the tribe to make informed management decisions grounded in the best available map-based data and science.
In 2016, the California Energy Commission funded the Conservation Biology Institute to undertake an advanced landscape condition analysis to use as a foundation for evaluation of ecosystems, species’ habitats, and areas planned for renewable energy development. This was subsequently incorporated into programmatic assessments by multiple State agencies, including the California Department of Forestry and Fire Protection’s Fire and Resource Assessment Program (FRAP 2017 Assessment) and the California Department of Fish and Wildlife’s State Wildlife Action Plan (SWAP 2025 Update).
The modeling approach employed by CBI synthesizes complex spatial information into a suite of accessible metrics to quantify terrestrial intactness, an estimate of the naturalness – or lack of human disturbance across the landscape – through a multidimensional lens. The resulting interactive product allows for identification of intact natural areas that maintain ecosystem integrity, thus maximizing support of wildlife and ecosystem services returned to Californians. It also highlights factors affecting the State’s landscape condition, such as infrastructure/urban development, and facilitates understanding the multitude of human impacts co-occurring along that continuum.
In 2024, the California Department of Forestry and Fire Protection (CAL FIRE) funded an update to produce a new version of this terrestrial intactness product, incorporating the most recent data on landscape impacts and providing a more comprehensive view of important considerations with new invasive vegetation and habitat fragmentation metrics. This analysis provides a present-day estimate of the degree to which California’s natural landscapes have been impacted by human disturbance and the drivers at play in any given location. The updated model and accompanying dataset’s comprehensive attribute information can be used for a variety of applications by both agencies and NGOs. These include characterization of intact natural areas that maximize ecosystem services to communities, such as access to nature and improvements in water quality, as well as assessment of ecosystem and species’ habitat condition, considering how various human impacts can be mitigated via strategic planning and targeted restoration efforts.
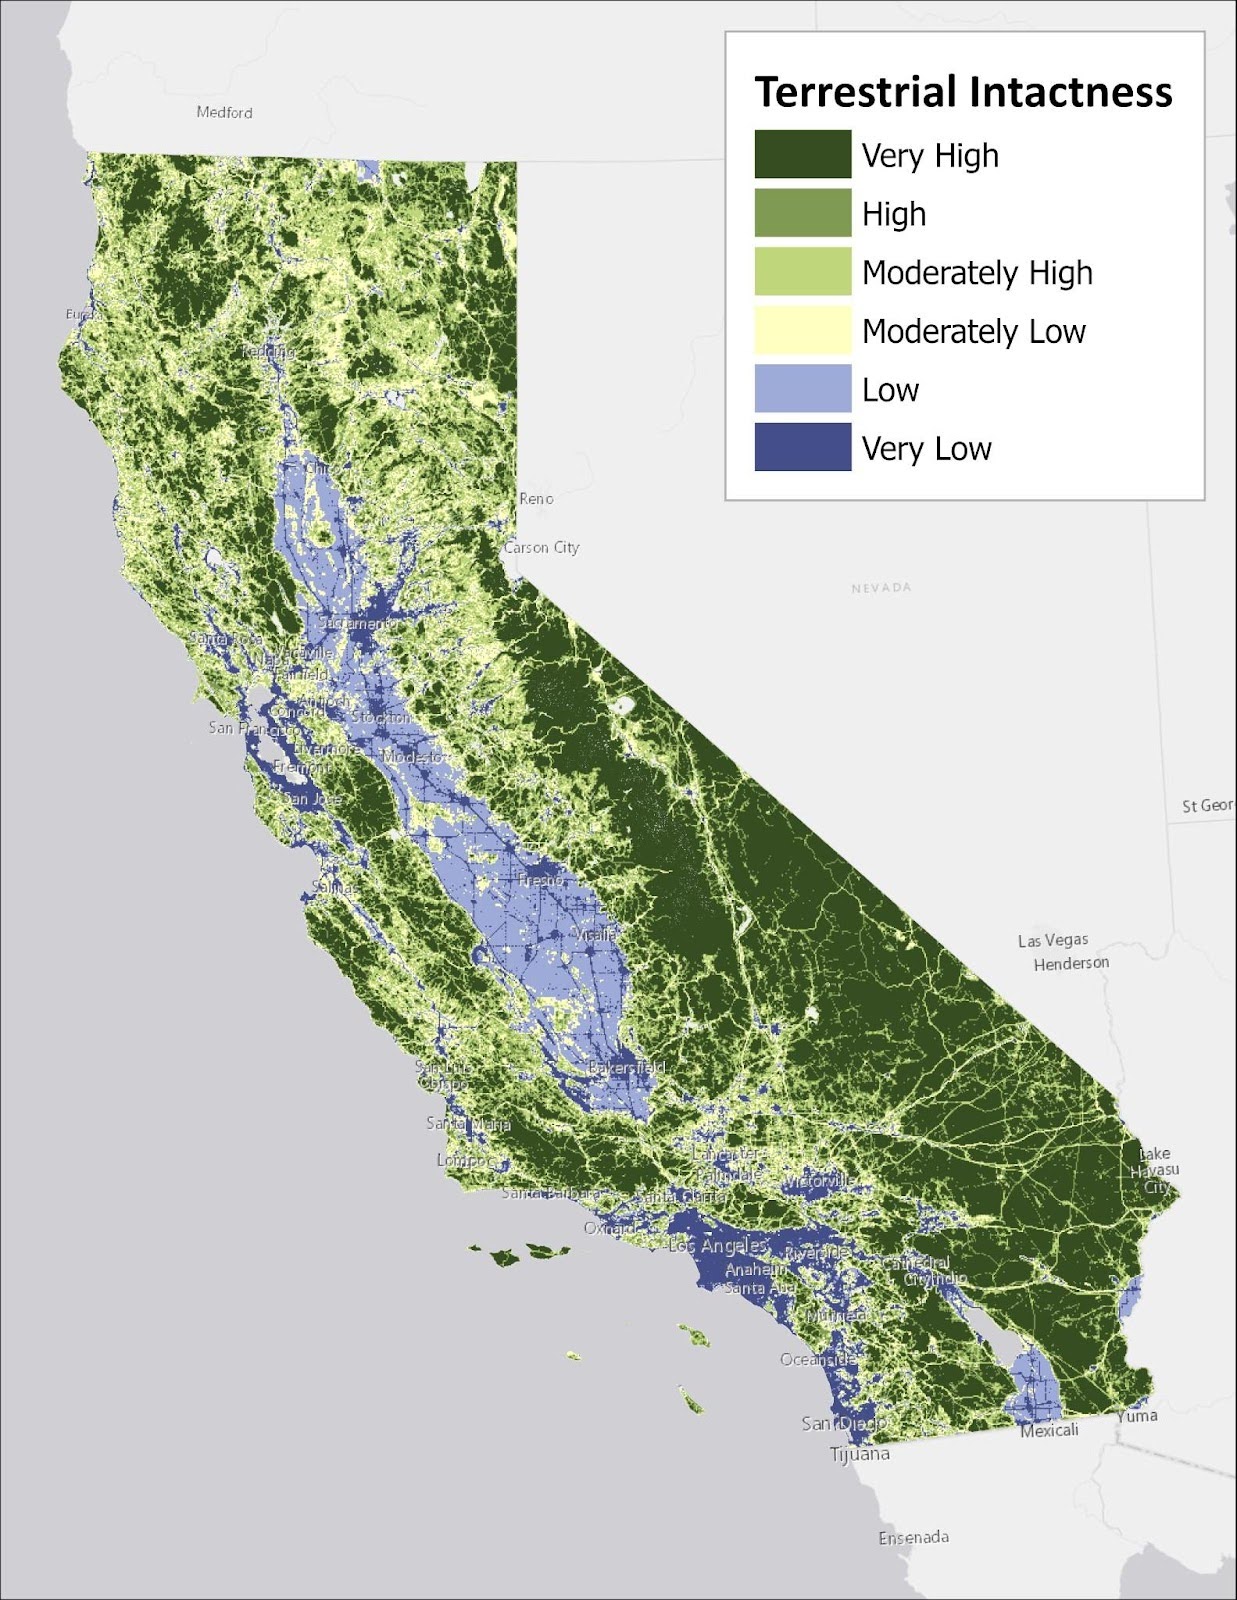
Significant improvements in data availability and quality inform the updated version of the landscape intactness product, as well as new metrics described above. The 2016 version was limited by lower quality input data and less sophisticated land cover mapping techniques than are currently available. The 2025 version has been crafted with an eye towards incorporating data derived from more advanced methods, likely to be updated at regular intervals, thus setting the stage for products more directly comparable across time. These upgrades and advancements in the analytical platform provide a basis for future work, such as finer resolution modeling that offers additional detail and functionality to the agencies, NGOs, and decision makers using CBI’s products to support scientifically-rigorous management of California’s resources.
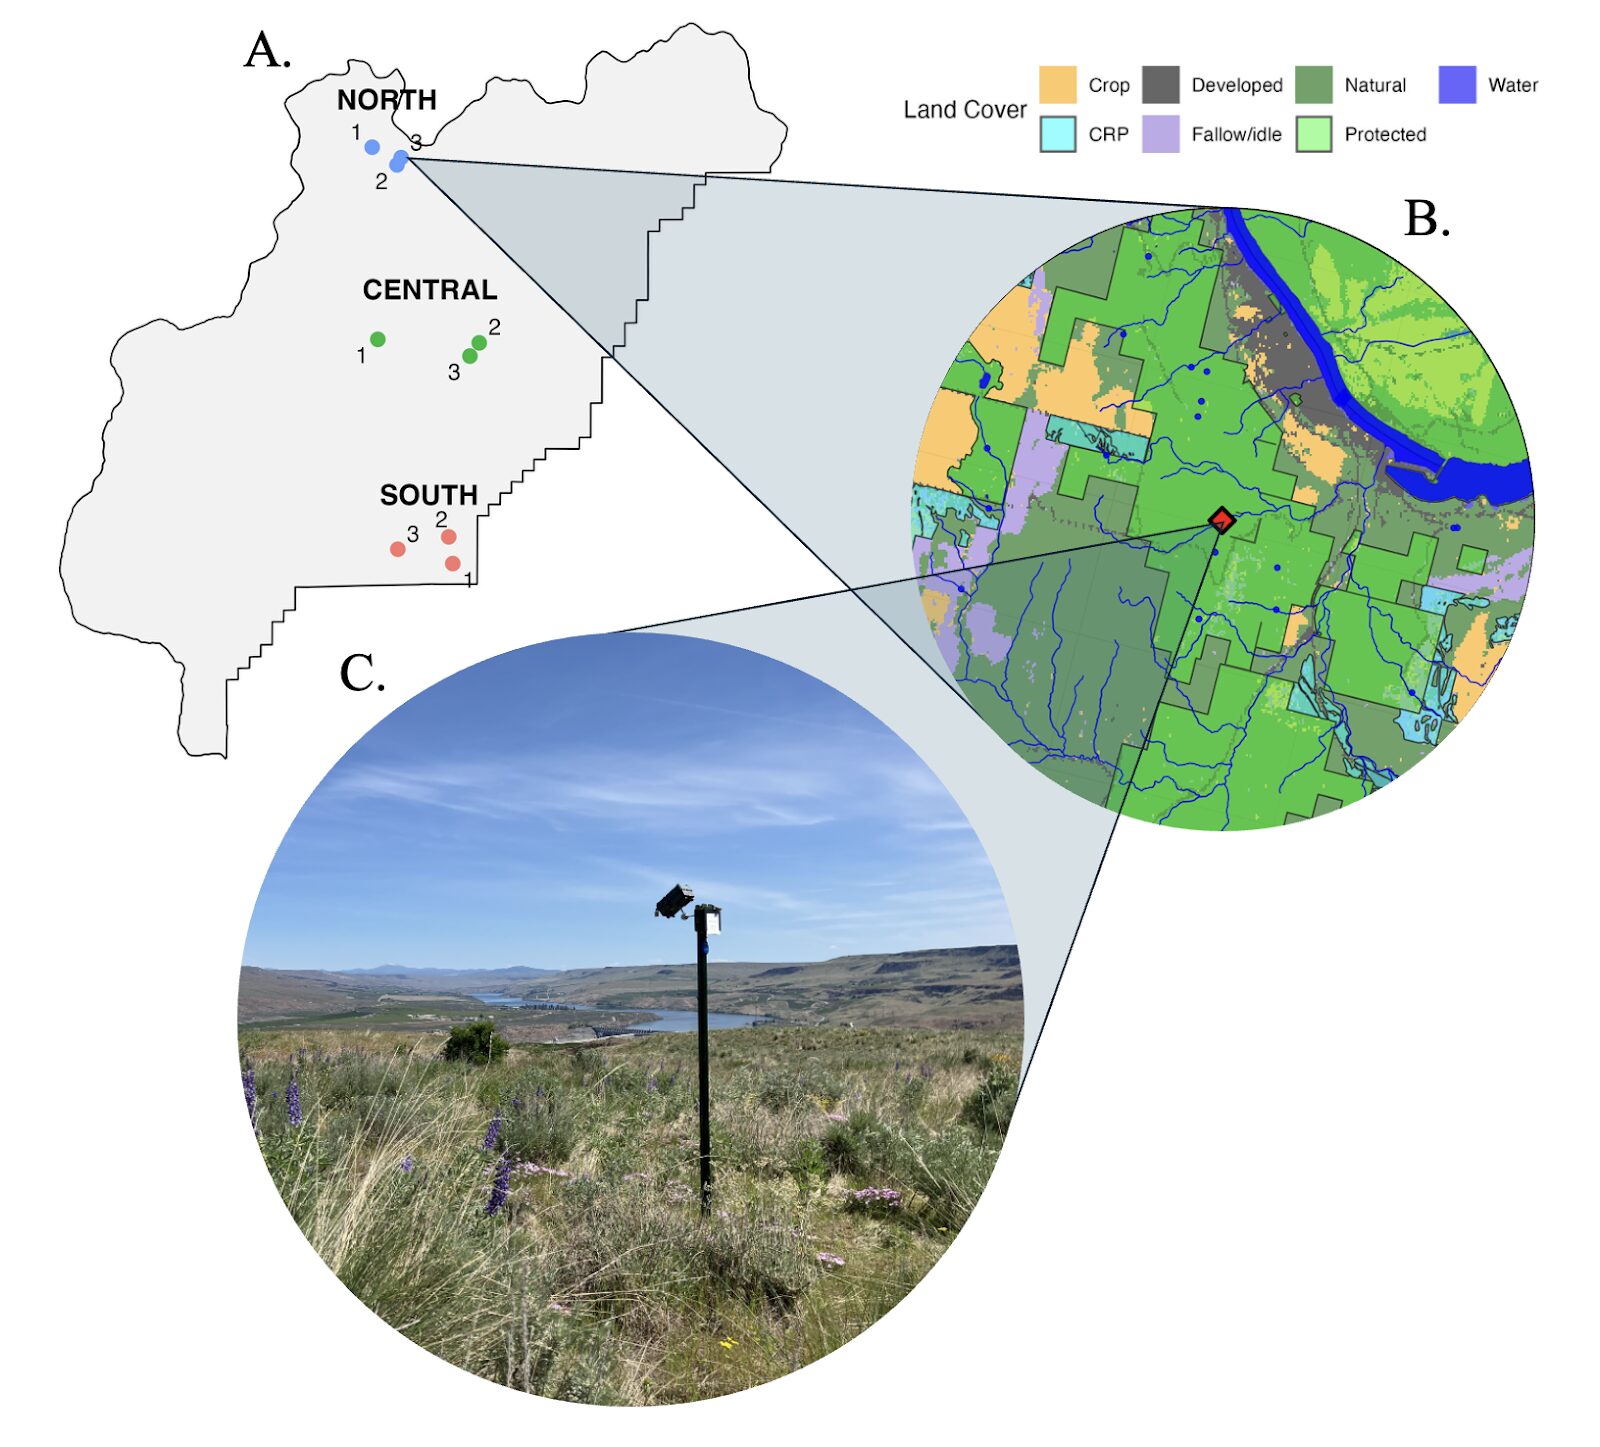
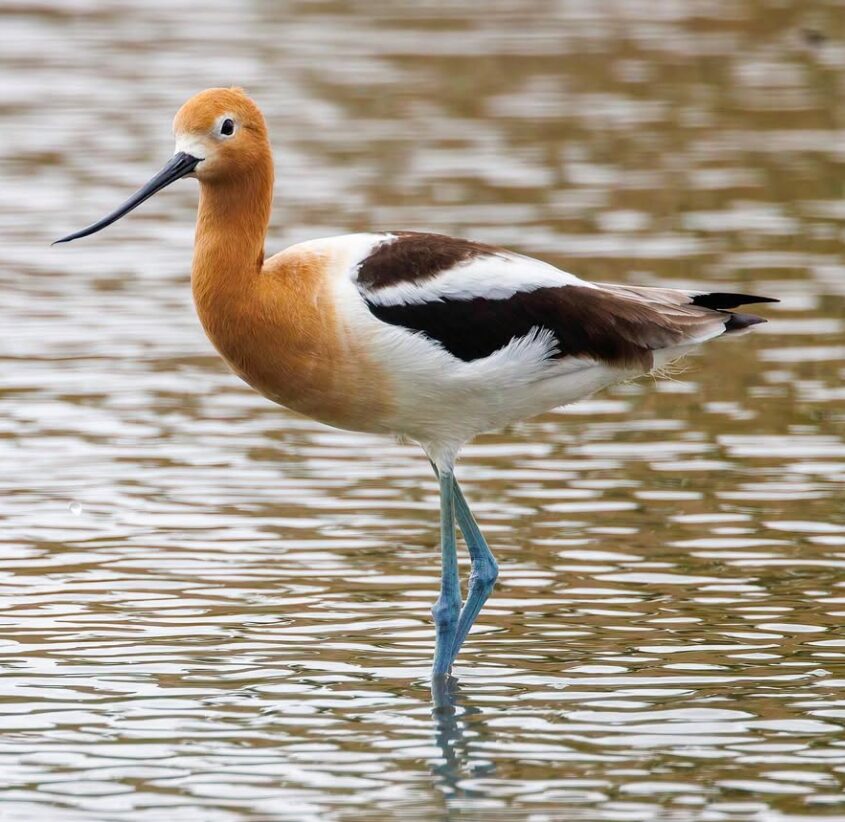
Bats provide critical pest control services in agricultural landscapes, yet agriculture poses significant direct and indirect threats to bats, primarily through habitat alteration and driving insect declines. This project investigated how agroecological land use—including the types of crops, the amount of protected land, and habitat restoration through the USDA Conservation Reserve Program (CRP)—affects bat activity and diversity in the Columbia Plateau ecoregion of Eastern Washington, focusing on the state candidate species, Townsend’s big-eared bat (Corynorhinus townsendii), and other bat species of conservation concern.
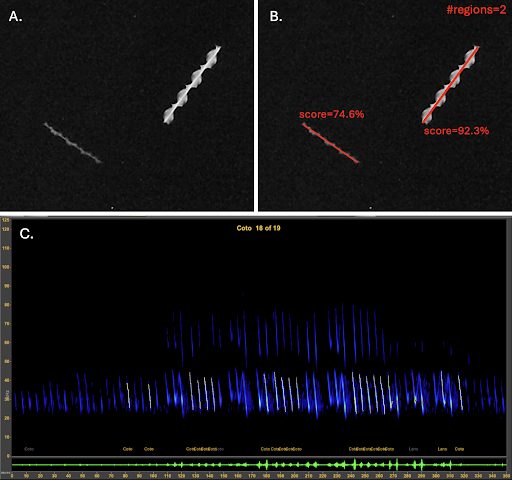
We deployed acoustic monitors to monitor bats and camera traps to monitor nocturnal flying insects across nine protected sites (BLM and WDFW) in Douglas County from July–October 2024 and March–June 2025, spanning 163 monitoring nights. These sites represented a gradient of surrounding land types—cropland, CRP restoration, and protected natural habitat. Using generalized linear mixed-effects models, we analyzed how bat activity, species richness, diversity, and feeding behavior were influenced by environmental variables including climate, land cover, water features, and nocturnal flying insect abundance.
Key Findings
We recorded all 14 bat species expected in the region, including all Washington State Species of Greatest Conservation Need (SGCN) expected in the region. We detected C. townsendii 19 times across six of nine sites and all three study regions. Temperature emerged as the dominant environmental driver of bat activity, with both short-term nightly temperatures and long-term minimum temperatures strongly predicting bat diversity, activity, and feeding intensity.
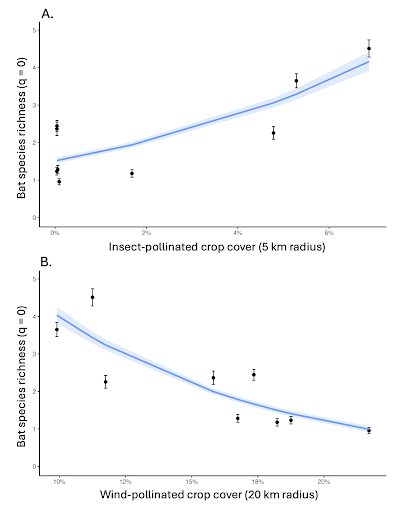
Agricultural practices showed contrasting effects on bat communities. Insect-pollinated crops and greater crop diversity within 2–5 km were strongly associated with increased bat diversity and activity, particularly benefiting C. townsendii and other moth specialists, while more wind-pollinated crops at 20 km scales were associated with decreased bat diversity and activity. Bat activity, diversity, and foraging showed consistent negative relationships with CRP land across multiple spatial scales and CRP practices, including permanent grass plantings (CP1, CP2) and wildlife enhancements (CP38E).
Protected areas increased the chances of detecting several species, including C. townsendii. The presence of more springs and seeps had positive effects on total bat diversity and activity, underscoring the importance of water features for bats. Nocturnal insect abundance showed modest but significant effects on bat feeding activity, with fine-scale temporal correlations observed throughout the night.
Management Implications
These findings indicate that diverse bat communities, including vulnerable species like C. townsendii, are an active and important component of the agricultural landscapes of Eastern Washington. The positive associations between bats and diverse insect-pollinated crops suggests that diversified agricultural systems may provide more valuable foraging habitat than simplified agricultural systems composed primarily of cereal grains, and perhaps more even than grassland restoration through the CRP. Indeed, although they warrant further investigation, our results suggest that in order to better support bats, the CRP should strive to encompass habitat types and landscape features, such as water sources, that bats and their insect prey rely on. Furthermore, our results highlight that maintaining and expanding protected areas, particularly those that include water sources, is critical for the conservation of rare and vulnerable species like C. townsendii in agricultural landscapes.
Recommendations
- Expand protected areas in key habitat areas for C. townsendii and other rare and vulnerable bat species
- Prioritize conservation efforts for C. townsendii in northern Douglas County, where the species mostly occurs
- Prioritize protection and restoration of springs, seeps, and other point water sources in agricultural landscape conservation planning
- Investigate additional factors (e.g., contract age) that may affect the value of CRP land to bats, and reevaluate CRP habitat management practices to incorporate habitat features that better support bats and their insect prey
- Encourage diverse crop rotations that include insect-pollinated species
- Implement long-term monitoring programs using validated passive acoustic and camera-based techniques
Felidae Conservation Fund, Bay Area Puma Project, and Conservation Biology Institute co-produce an analysis and project to improve the connection to and from Mount Diablo
Description
The project aims to address the pressing issue of habitat fragmentation and lack of connectivity for mountain lions in the East Bay Diablo Range of the San Francisco Bay Area in California. The current situation poses a significant risk of inbreeding and local extinctions among these iconic predators, further threatening the fragile biodiversity of the region.To tackle this challenge, our project will identify potential linkages and barriers to movement for mountain lions, with the goal of establishing evidence-based conservation strategies. We will employ cutting-edge connectivity modeling and mapping techniques. We will also utilize state-of-the-art remote-sensing camera arrays to capture and analyze wildlife movement patterns in the East Bay Diablo Range. These camera arrays will provide valuable data to ground-truth linkage models, allowing us to accurately identify potential corridors and barriers for mountain lion movement. By combining cutting-edge modeling techniques and technology with on-the-ground fieldwork, we will enhance the precision and effectiveness of our conservation strategies, ensuring that our efforts are grounded in robust scientific evidence.
By identifying and restoring crucial corridors, we aim to mitigate the adverse effects of habitat isolation, promote gene flow, and safeguard genetic diversity among mountain lion populations. This, in turn, will contribute to the overall health and resilience of the East Bay Diablo Range ecosystem.
The project’s success will rely on a multidisciplinary approach, combining scientific research, community involvement, and policy advocacy. By addressing the challenges of habitat fragmentation and promoting connectivity, we aim to ensure the long-term persistence of mountain lions in the East Bay Diablo Range while preserving the rich biodiversity that characterizes this unique region.
Overall, this project represents a vital opportunity to protect and restore critical habitats, prevent local extinctions, and secure the future of mountain lions in the San Francisco Bay Area. By investing in the conservation of these iconic predators, we will safeguard the ecological integrity of the East Bay Diablo Range and also enhance the overall health and resilience of the region for generations to come.
The Project Page for this is periodically updated, and is currently located at
https://felidaefund.org/projects/research/pumalink
Because of the importance of the Central Valley of California to shorebirds along the Pacific Flyway, considerable conservation investments have been made in the area’s agricultural fields and managed wetlands. Through their BirdReturns and Bid4Birds programs, The Nature Conservancy and the California Ricelands Waterbird Foundation pay rice farmers to flood fields to decompose post-harvest rice thatch and, in doing so, create habitat for shorebirds. Previous research by CBI and The Nature Conservancy researchers found that shorebird density (birds/hectare) increased with earlier fall flooding and in fields managed to be approximately 50% flooded, 5-10 cm deep, and with minimal straw or stubble cover in fall. Lower soil clay content and flooding consistency – either at a site that is continually flooded over many months or a site that has been flooded in previous years – was also associated with higher shorebird density. Finally, the team found preliminary evidence that fields flooded by groundwater, instead of surface water, were associated with higher shorebird density. These findings are important for guiding continued shorebird management in agricultural landscapes.
Combining the five years of data on shorebird abundance used in the original study with an additional five years of more recent data, we are going to expand our preliminary analysis on the importance of water source on shorebird abundance. Specifically, we are going to explore whether more shorebirds are found in fields flooded with surface water versus groundwater. Assuming that shorebirds prefer groundwater in the expanded analysis, our next priority is to explore why, where our first hypothesis is water quality. Using a number of public resources that sample groundwater quality (nitrates, sodium, and arsenic) and surface water quality (pH, turbidity, temperature, conductance, and dissolved oxygen), we will explore whether shorebird abundance is associated with any of these water metrics. Determining the best practices for habitat creation in agricultural landscapes is critically important for conservation and recovery of declining shorebird populations.
Providing Tools for USDA Monitoring and Assessment
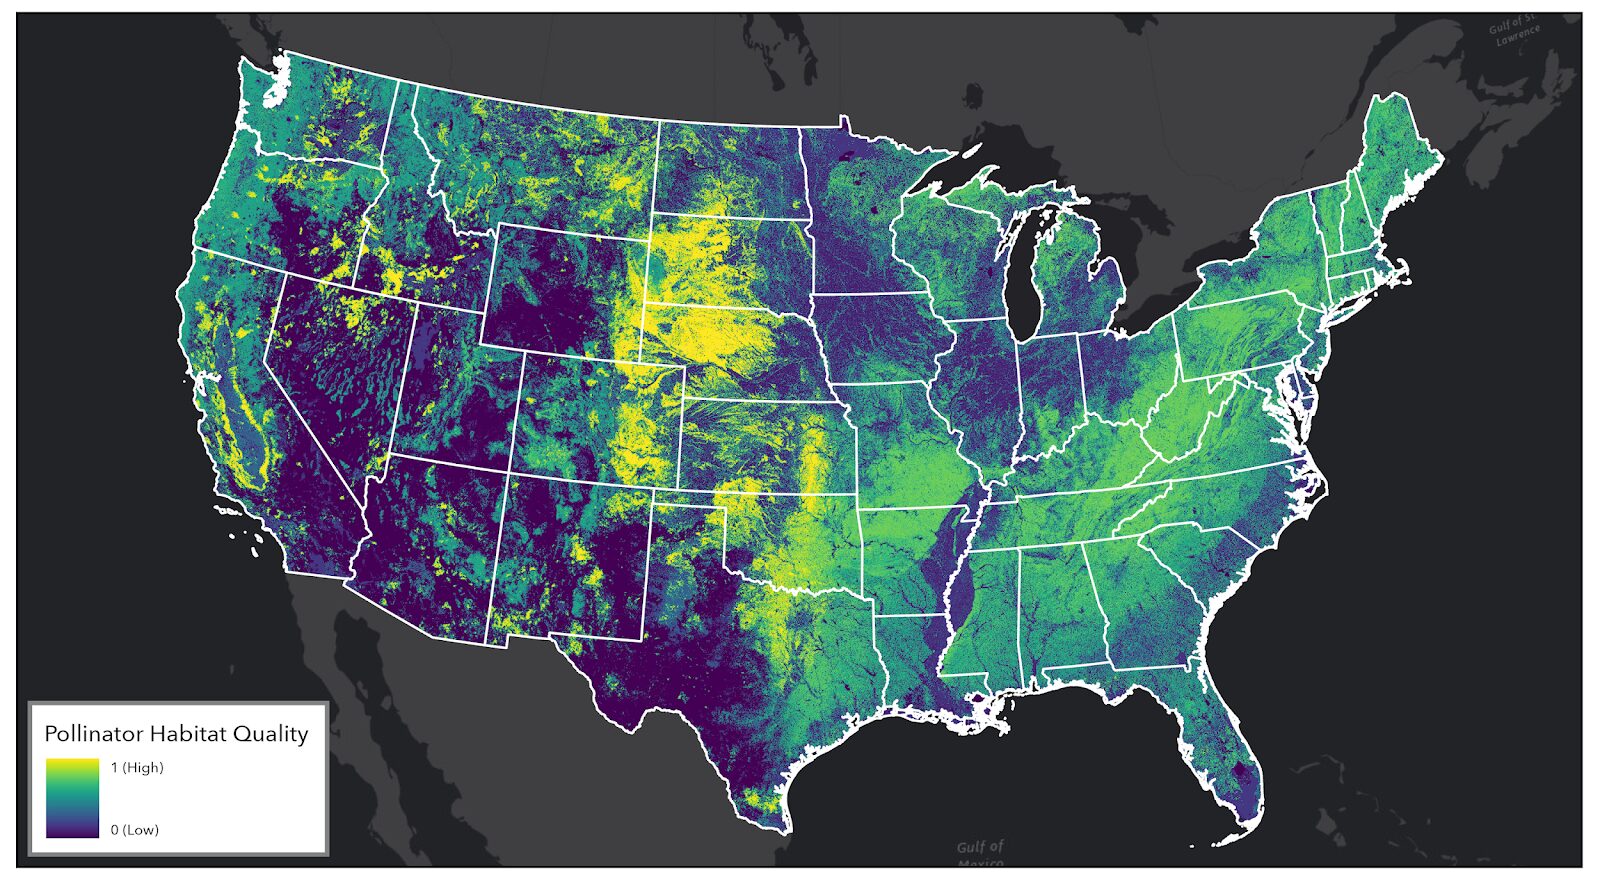
CBI is using the latest remote sensing, machine learning, and modeling approaches to assess the quality of grasslands and pollinator habitat. Outputs from this analysis will be delivered to USDA through an online-decision support system, designed and built by CBI, called the USDA Conservation Toolkit. This suite of map-based tools will support the USDA Conservation Reserve Program (CRP) and other land-based conservation and restoration programs operating across the United States. CRP currently covers ~24.8 million acres of working lands nationwide.
Goal: Assess ecosystems services across the CRP portfolio
- Generate products to support USDA policies and program initiatives
- Provide actionable conservation intelligence
Targets
- Quantify foundational supporting ecosystem services across CRP enrollments
- Grasslands ecosystem quality
- Pollinator habitat quality
- Incorporate resulting spatial data and metrics into online applications, allowing for program reporting at multiple scales
- A priority for this effort is to quantify the CRP national portfolio return on investment, screening enrolled farms, and assessing at state, regional and national scales
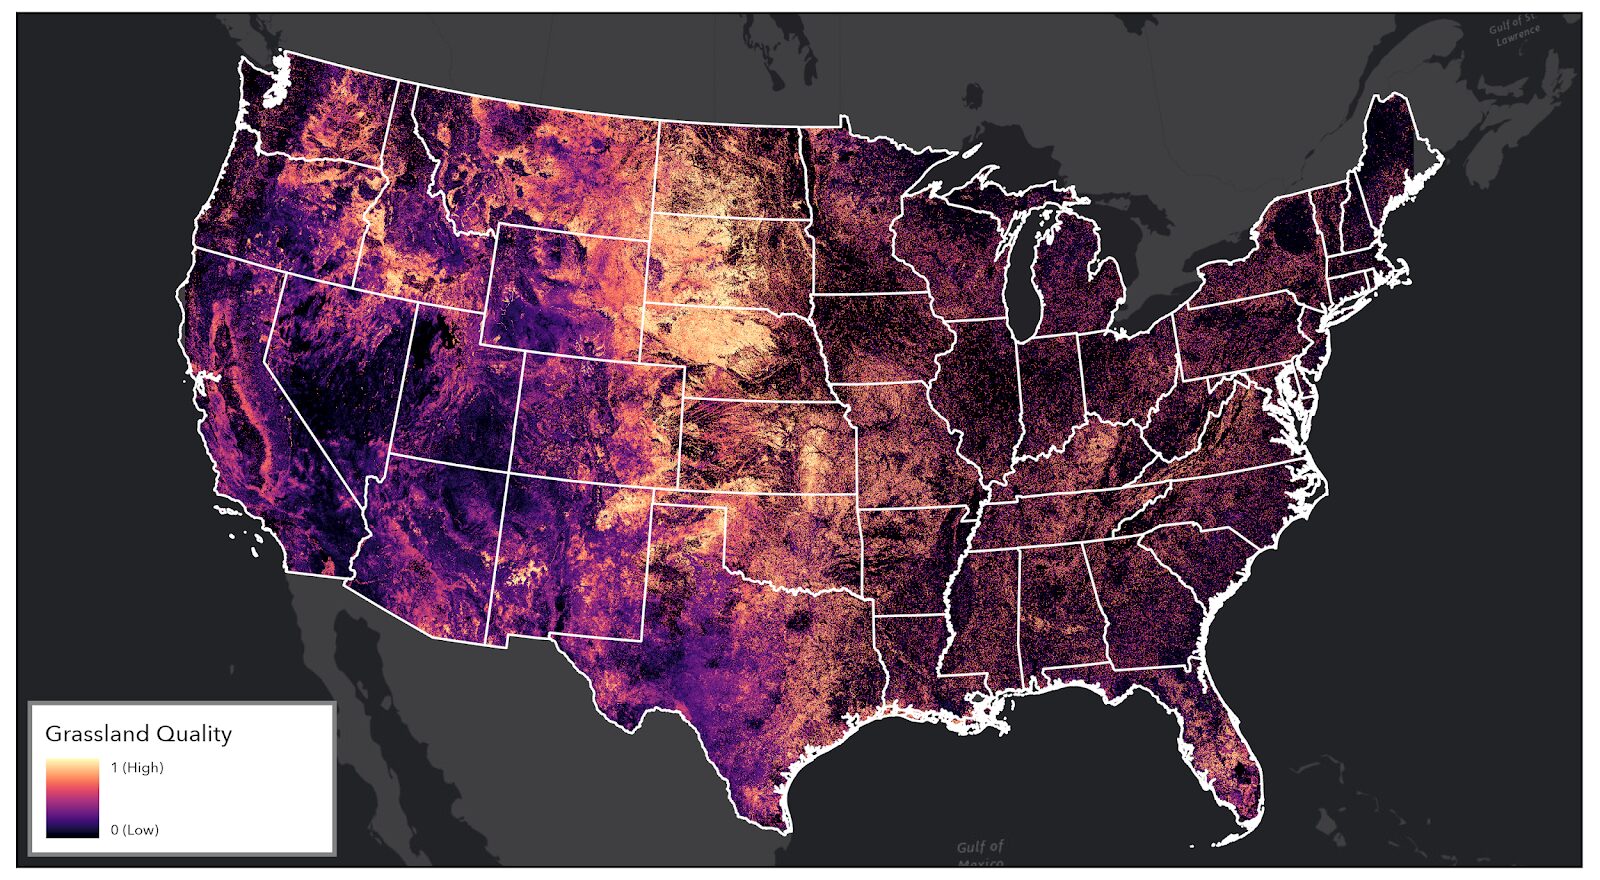
CBI CRP Grassland Quality Model – Overview
Components
- Integrative, comprehensive approach to modeling using the best available spatial data and remotely sensed metrics (e.g. National vegetation surveys, NLCD, Rangeland Analysis Platform (RAP), custom CBI products)
- Leverages outputs from the Google Earth Engine (GEE) cloud-computing platform with CBI’s customized library of 200+ vegetation indices
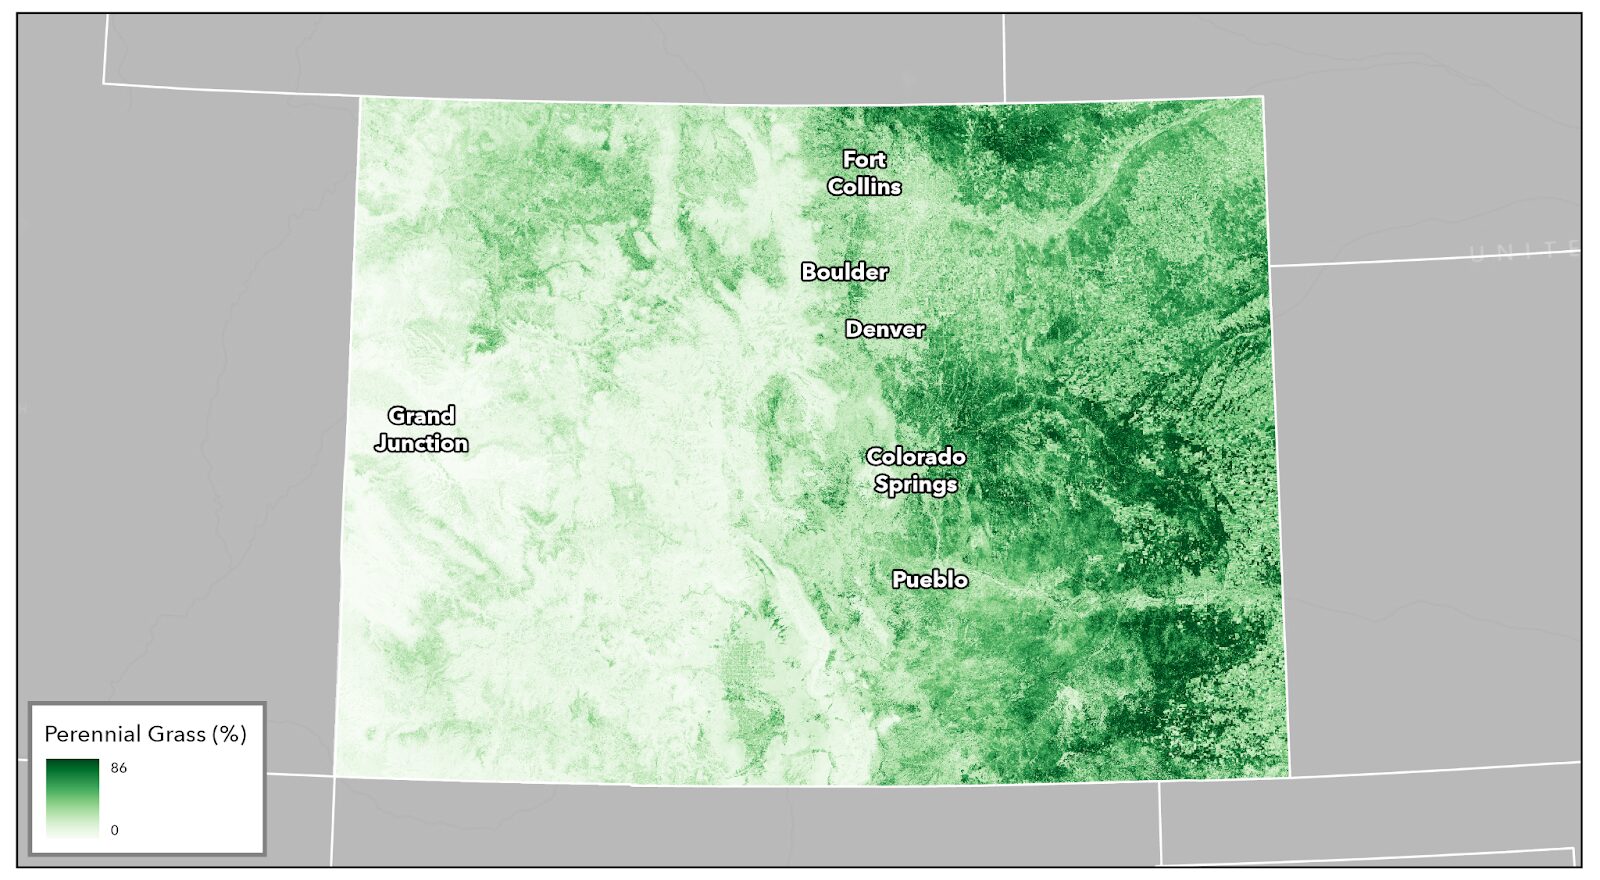
What does it tell us?
- Indicator for ecosystem health, form, function, and supporting services strength, based on the USDA grassland operational definition (USDA-NRCS 2024, National Resources Inventory Grazing Land On-Site Data Collection Handbook)
- Complements existing frameworks (Rangeland Health Assessment) and other modeling efforts (RAP, K. Barnes 2024)
What does it offer USDA?
- Multi-scale (non-monetary), valuation of ecosystem condition for CRP enrolled lands and surrounding landscape
- Insights on baseline field-level condition and landscape-level spatial analytics for CRP assessment and reporting
- Illustrates CRP return on investment at a programmatic scale and quantifies enrolled land performance with nuanced metrics
How is it unique?
- Hierarchical measure of grassland ecosystem vigor, community composition, and resilience
- Expandable framework produces multidimensional metrics to quantify patterns across the landscape
- Summarizes information across CRP farms and practices
- Offers insights on baseline current state and local condition at multiple scales
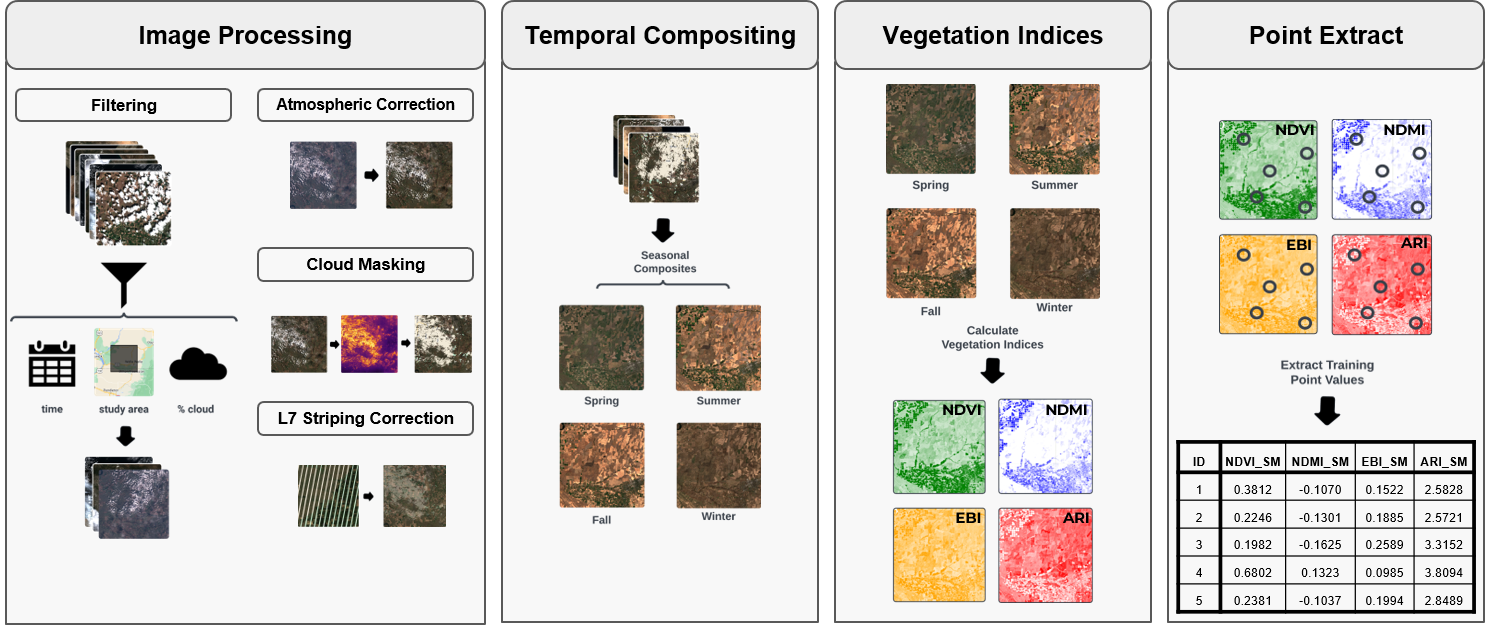
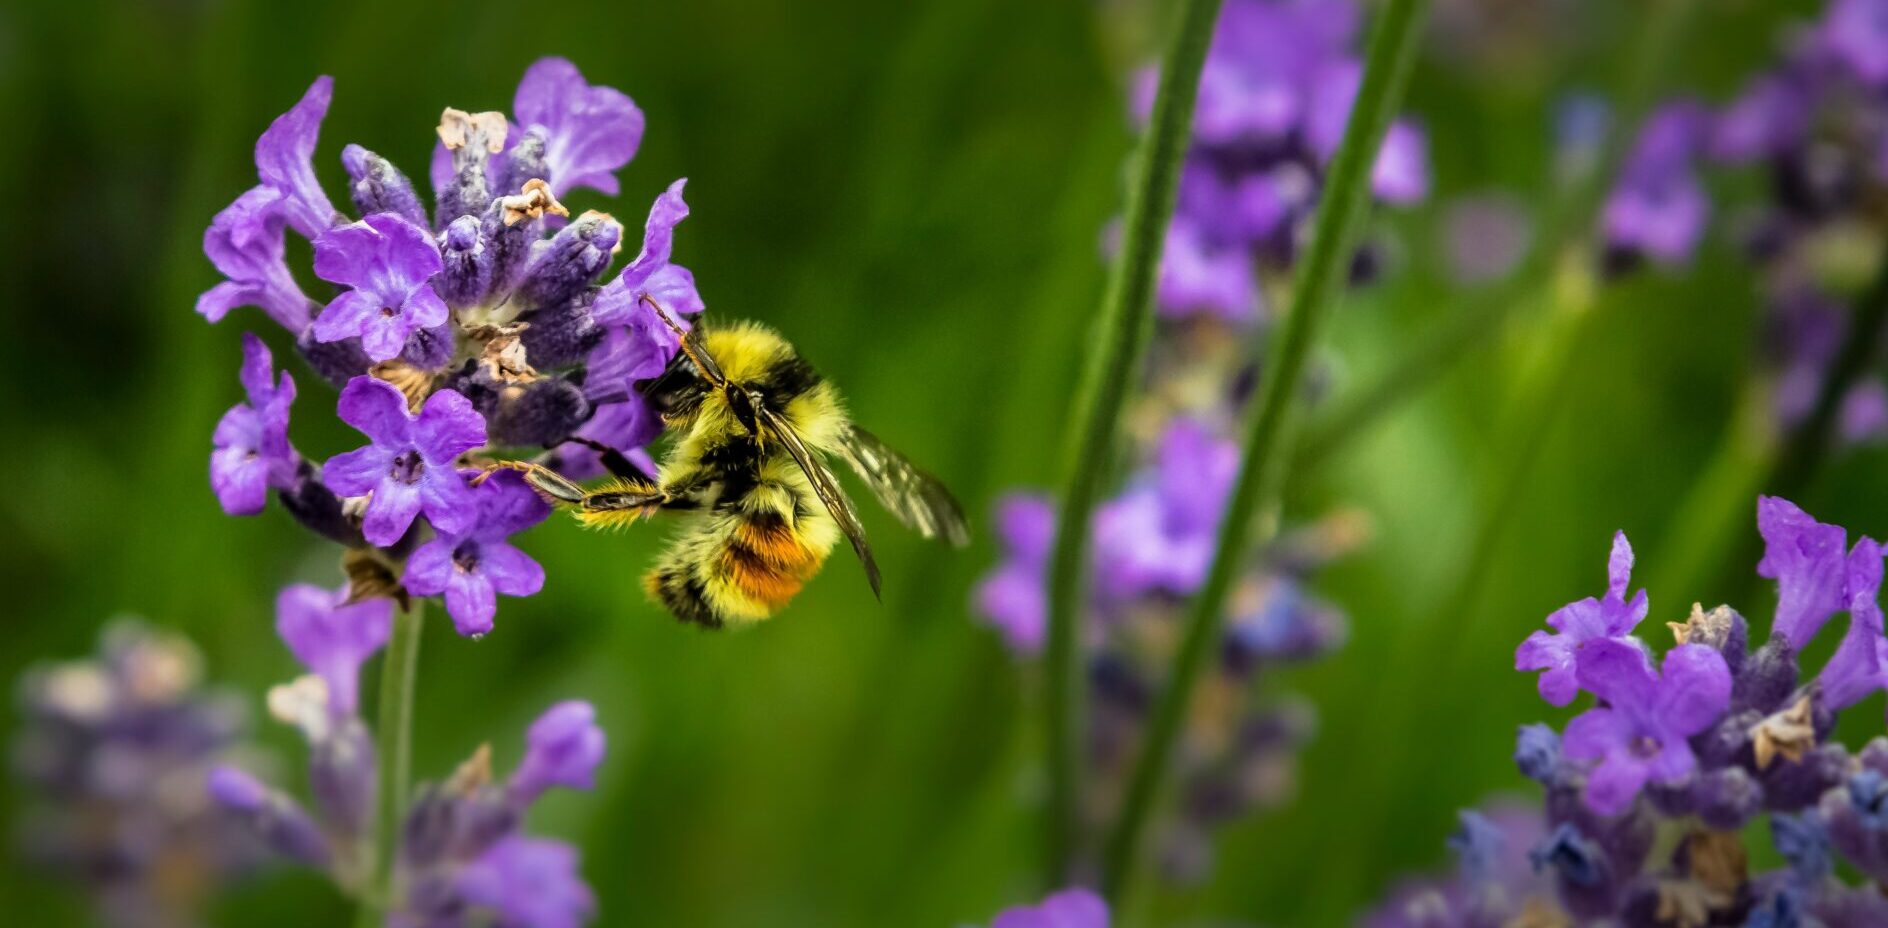
Pollinator Habitat Quality Model – Overview
Components
- Integrative, comprehensive approach to modeling using the best available spatial data and remotely sensed metrics (e.g. US National Phenology Network, NLCD, Rangeland Analysis Platform (RAP), NatureServe Explorer, custom CBI products)
What does it tell us?
- Describes pollinator natural resource needs and spatial use of the landscape
- Indicator for pollinator population health and pollination service strength
- Spatial complement to on-ground pollinator assessments funded by USDA
What does it offer USDA?
- Multi-dimensional, non-monetary valuation of pollinator habitat
- Foundation for field to landscape-level spatial analytics for CRP assessment and reporting
- Illustrates CRP return on investment at a programmatic scale and quantifies enrolled land performance with nuanced metrics
How is it unique?
- Builds on the benchmark InVest© model framework
- Informed by 300,000 bee observations from the Global Biodiversity Information Facility (GBIF)
- Innovations for bee flight, nesting, and floral suitability estimates
By disrupting wildfire regimes, climate and land use change transform ecosystems, alter carbon budgets, and drive socio-economic impacts in California. We propose to quantify how projected peri-urban growth in the wildland urban interface, climate change, and local management actions influence wildfire activity and downstream effects on vegetation transitions, carbon release, biodiversity, and vulnerable human communities.
We will model wildfire risk as a function of a limited set of stakeholder-guided, realistic future scenarios, using the LANDIS-II simulation model. Past studies have shown the importance of human ignition location and timing on wildfire activity in Southern California, a mechanism we will explore using different land use change scenarios.
We will also model and analyze the potential influence of increasing atmospheric aridity on fire size and severity in forests and compare these effects to adjacent shrubland plant communities.
Taken together, climate, land use, and other environmental variables can lead to fire-driven vegetation type conversion, which can influence carbon sequestration, biodiversity, and even future fire risk to human communities.
Finally, we will explicitly evaluate how different modeled management actions influence wildfire, plant succession, and carbon sequestration. The resulting maps and spatial products will help managers prioritize locations for conservation and management actions. Overlaying maps of vulnerable human communities and biodiversity hotspots with future wildfire change and downstream impacts can better define locations for priority action to facilitate co-benefits to human and natural resources. This research will contribute to scientific publications and be directly relevant to managers, including the Southern California Montane Forests Project.
The San Diego Zoo Wildlife Alliance (SDZWA) is a world-renowned conservation organization with a 1800-acre zoo, the Safari Park, that houses more than 2600 animal and 3500 plant species. Located in Escondido (northern San Diego County), the Safari Park also includes a 800-acre biodiversity preserve with some of the most well-preserved, California-endemic coastal sage habitat.
In 2007, the Witch fire burned through 600 acres of the biodiversity reserve and stopped just outside the Safari Park borders. Since then, the SDZWA has transformed their in-house wildfire preparedness program, including hiring a team of dedicated wildfire suppression staff, fire suppression equipment boxes scattered throughout the park, an infrared and visible spectrum camera array for early ignition detection, and a 8500-gallon water tank for aerial suppression by local first responders.
While these investments in wildfire readiness are important for protecting the Safari Park grounds, landscape-scale risk analyses are needed to determine where fires may start and spread outside of park boundaries and which additional management activities could mitigate risk from fires originating beyond Park borders. Conservation Biology Institute (CBI) and Dudek have proposed to co-create the needed wildfire risk analysis for the SDZWA Safari Park.
At the core of the risk analysis is a fusion and comparison between two commonly employed modeling efforts used in
CBI is a partner in producing a statewide wildlife connectivity ensemble model and associated mapped data in support of a connectivity action plan for the state, which is under development. The modeling will identify priority areas across the state in need of some form of mitigation to promote wildlife connectivity and reduce wildlife/vehicle collisions at the same time. The co-production process includes the close collaboration with an active Technical Advisory Group. The project is being funded by the Washington Department of Fish and Wildlife.
The Giant Sequoia Lands Coalition (GSLC) is a collaboration of public and non-governmental organizations committed to the conservation of giant sequoia grove ecosystems. CBI is supporting the GSLC’s Sequoia Grove Protection and Resiliency Project with tools and assistance that will enable GSLC partners and stakeholders to work collaboratively to protect the species from the impacts of drought, beetles, and wildfire made more intense by climate change.
CBI is using its Data Basin platform (databasin.org) to host the Giant Sequoia Data Portal. The portal will be populated with custom maps of the sequoia groves linked to standard metrics and data for assessing grove condition, fuel treatments, and other range-wide information. To inform this giant sequoia management “dashboard” CBI is working with the GSLC to catalog an extensive collection of assessment, monitoring, and remote sensing datasets created by different agencies and projects over many decades of forest management and research. CBI will train and support the GSLC partners in their use of the Giant Sequoia Data Portal for promoting coordinated scientific research, monitoring, long-term species conservation, and continuing to share new data as it becomes available.