The primary objective of this study was to perform an enduring features conservation gap analysis for a pilot region within the U.S. (northern Rocky Mountains) that applied the same methodology as WWF Canada, resulting in a consistent crossboundary conservation assessment for the region for the first time. The Rocky Mountains were chosen over other crossboundary areas because this region is under increasing pressure from human enterprise on both sides of the border, yet it still maintains a full compliment of species including large carnivores. The conservation actions taken over the next decade will largely determine whether this portion of the Rocky Mountains continues to function in a way that supports the many species and natural processes which have made it world famous: there is much at stake.
The greater study area as taken from the Carnivore Strategy included the Rocky Mountains in BC and Alberta and the U.S. northern Rocky Mountains (approximately 690,000 square kilometers). This GIS-based research project concentrated mostly on the U.S. side of the border, as we attempted to duplicate the Canadian methodology on similar, but different, electronic datasets. The region was first subdivided into 50 ecosections (or natural regions), 32 of which were exclusively contained within the U.S. or straddled the Canada – U.S. border. Enduring features were then mapped and representation evaluated for each of the 32 ecosections. Finally, these results were added to the Canadian work for regional summarization. In addition to the enduring features gap analysis, enhancements to the methodology were examined for the U.S. portion of the study area using larger scale datasets. A physical units mapping procedure was developed and examples compared to the coarser scale enduring features analysis. Finally, a number of separate analyses (e.g., road density analysis) were performed for the U.S. portion of the study area that can now be used to support continuing conservation research in the region.
CBI investigated the effects of climate and vegetation on the distribution of martens (Martes caurina) and fishers (Martes pennanti) in the Sierra Nevada in California under current and projected 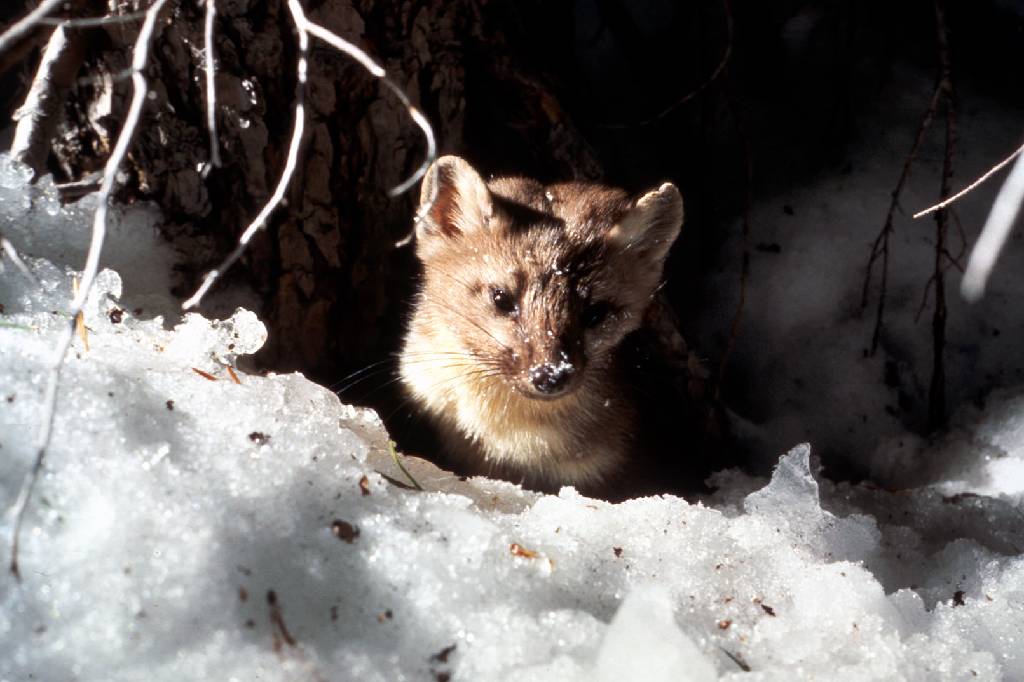 future conditions to inform conservation efforts for these species and to investigate how different modeling methods and resolutions may affect predictions about species’ responses to climate change. Martens and fishers are closely related forest carnivores of conservation concern in California, where both reach their southernmost distributions. The species have contiguous elevation ranges, with the smaller marten occupying high subalpine forests that experience deep and persistent snow, and the larger fisher occupying mid-elevation forests that experience less snow and warmer temperatures.
The goals of this project were to:
- add robust, downscaled, climate-change effects assessments to CBI’S Sierra Nevada Carnivores project, which is a comprehensive, science-based effort to map areas important to sustaining rare carnivore populations and improving forest management.
- compare alternative analytical approaches and resolutions for assessing climate impacts on vegetation and sensitive species.
 Because martens and fishers require similar forest structural conditions (dense forests with large trees and abundant dead wood) but different climate regimes (cooler, moister, and snowier conditions for martens; warmer, drier and less snowy conditions for fishers) they offer a unique opportunity to investigate how our changing climate may affect the species directly as well as via changes in vegetation. Also, because they compete with one another for food, and fishers will kill martens when they meet, this system offers an opportunity to investigate how species interactions may also affect future populations.
Specific study tasks:
- Examine how the current distributions of martens and fishers are influenced by vegetation characteristics (e.g., forest composition and structure), climate (e.g., temperature, precipitation, snow depth and duration), physical variables (e.g., elevation, % slope) and presence or absence of the other species.
- Project the potential future distribution of both species under climate change based on results of Task 1 and using alternative emissions scenarios and general circulation models at different resolutions.
- Use the results to support conservation and forest management plans to ensure long-term sustainability of marten and fisher populations in the face of climate change and increasingly severe fire regimes.
Click here for Methods, Outcomes, Interpretation and Related Data
Wolves were extirpated from the Adirondacks over a century ago due largely to human eradication efforts. The Conservation Biology Institute (Corvallis, OR) was chosen by the Adirondack Citizens Advisory Committee to examine the question of biological feasibility of reintroducing gray wolves back to the Adirondacks. By applying what is known about gray wolf ecology (in general) to the best available spatial and genetics data for the Adirondacks, we examined three basic questions:
- Is there suitable gray wolf habitat in the Adirondacks to support a viable population?
- Is there adequate landscape connectivity both within the Adirondacks and between the Adirondacks and the surrounding region to allow for reasonable gray wolf movement important to their persistence?
- What does the most recent genetics tell us about wolves in the Adirondacks?
The Klamath-Siskiyou ecoregion of southwest Oregon and northwest California has long been recognized for its global biological significance and is considered an Area of Global Botanical Significance by the World Conservation Union, a global Centre of Plant Diversity, and has been proposed as a possible World Heritage Site. More recently, World Wildlife Fund US scored the Klamath-Siskiyou as one of their Global 200 sites reaffirming its global importance from the standpoint of biodiversity.
CBI used GIS as the principle tool to assess the state of the environment in the Klamath-Siskiyou and to develop a reserve design proposal based on the three-tracks. GIS is a computer-based analytical mapping technology that is rapidly becoming the cornerstone for conservation planning at many different spatial scales.
The proposed work plan called for the analysis to be focused at the 1:100,000-map scale using the best available data. While the 1:100,000 remained our target planning scale, we incorporated larger scaled data (e.g., 1:24,000) wherever possible. Doing so allowed for much more meaningful and reliable analyses. One of the greatest challenges throughout this project was evaluating and integrating the various data layers acquired from numerous sources.
The purpose of this project was to create a GIS-based model that identifies specific focal areas throughout the range of the redwoods. Focal areas were defined as zones that offer the best conservation opportunities for long-term protection and maintenance of the redwood ecosystem based on current conditions. GIS was utilized because of its spatially explicit architecture and advanced analytical capability.
This model was produced for Save-the-Redwoods League as part of their overall Master Plan – an organizational blueprint for protecting the redwood ecosystem. More specifically, this model was intended to help the League target their future proactive conservation planning efforts more effectively as part of their overall conservation mission while supplying a broader organizational tool that could be shared with its conservation partners in the region.
1. Protected areas form one of the main pillars of biodiversity conservation throughout the world. Only 1.2 percent of the Alberta Foothills is currently protected, which is woefully inadequate by any scientific standard.
2. Protecting the full array of native biodiversity (representation) is an extremely important consideration in a regional protected areas strategy.
3. Approximately 75 percent of the natural variability present in the Alberta Foothills (measured as enduring features) is not adequately represented in a network of protected areas.
4. Approximately 82 percent of the region is comprised of logging tenures and much of this same area is subjected to intensive oil and gas development.
5. Change detection analysis has shown that nearly 9 percent of the ecoregion (~640,000 ha) has been impacted by activities visible from space since 1990 and much of this has been either by a growing network of oil and gas infrastructure or as clusters of clearcut logging. Impact on some species (e.g., woodland caribou) far exceeds this area.
6. The region contains over 36,000 wells, numerous pipelines, and thousands of kilometers of seismic exploration.
7. The Alberta Foothills no longer possesses large intact forest landscapes (undisturbed blocks >50,000 ha), but approximately 1/3 of the region is comprised of smaller forest remnants (over 2,100 with mean size of 1,500 ha) which forms the natural backbone of the region and form one of the major building blocks for protecting the many ecological values identified in the region.
8. Biodiversity values evaluated in the endangered forest mapping included: (1) rare forest types (old growth and less fragmented forests), (2) locations of rare and endangered species and their special habitats, (3) woodland caribou, (4) grizzly bear, (5) freshwater species such as bull trout and arctic grayling, and (6) forest and water-dependent bird species. Many of these values are being seriously degraded and some threatened with local extinction.
9. Decision support mapping results highlight areas within the Alberta Foothills that still contain high values and some of these values are of global or national significance. The highest scoring areas should be considered as candidates for an expanded protected areas network for the region. Recommended starting target should be approximately 16 percent of the ecoregion including existing and new protected areas. Failure to act will result in numerous species extirpations and significant loss of overall ecological integrity, including the degradation of several important ecosystem services.
10. In addition to new protected areas, landscape connectivity along waterways and over land should remain as an important consideration in an overall regional conservation strategy.
11. To be effective, an expanded protected area network alone will not be enough to maintain the conservation values present in the region today. New protected areas should be established strategically in the context of a region under dramatic pressure from development and extractive use. Management and even restoration in some areas should also be considered in an overall plan to achieve ecological sustainability.
12. The combination of Neatweaver®, EMDS®, and ArcMap® provides a powerful decision support planning tool set that can successfully address the topic of High Conservation Value and Endangered Forests.
In November 2002, two science-based conservation organizations, the Conservation Biology Institute (Corvallis, Oregon) and World Wildlife Fund (Ashland, Oregon), conducted an ecological assessment of the mid and lower reaches of the Klamath, including its tributaries and the Upper Sacramento River that flows into the mid Klamath.
Ecosystem health was assessed using computer mapping (Geographic Information Systems – GIS) and satellite interpretation technologies across 870 watersheds; 655 within the mid and lower Klamath and 215 within the Upper Sacramento River. We used a series of indicators or surrogates to assess watershed condition on a relative basis, including road density, stream-road intersections, logging in the basin over a three-decade period, and mining activities.
Because this is the first subbasin assessment of relative ecological condition of the mid and lower Klamath River, this executive summary will focus mainly on the Klamath findings as they are particularly relevant to policy and legislative efforts to manage water uses and restore ecosystem health throughout the Klamath River. In addition, according to monitoring stations of the United States Geological Service, the Klamath is in worse shape today than it was in 2002, the year that 34,000 to 68,000 salmon and trout died from disease in the lower Klamath River due primarily to low water flows and high water temperatures.
As more people move into remote areas throughout western forests and rangelands, it is increasingly important for scientists, land managers, policy makers, and the public to understand the natural fire dynamics of these systems. Over the last decade, wildfires have burned on average approximately 4.2 million acres each year with lows of 2.3 million acres in 1993, 1995, and 1998 and a decadal high of 8.4 million acres in 2000 (NIFC 2004). There is growing concern about the number of severe fires throughout the West and their impact on human communities and local economies. Some argue that the buildup of fuels to unnatural levels is primarily the result of decades of fire suppression while others argue that prolonged and more frequent droughts are most responsible. While both positions are defensible, it is unwise to oversimplify the situation as natural fire regimes and the human impacts on these regimes can be quite complex and highly variable from place to place (Turner et al. 2003).
The purpose of this study was to develop an approach to mapping fire hazard at an intermediate spatial scale for the Oregon portion of the Illionis River Basin and to demonstrate how such an approach can be used to identify and prioritize fire management activities that would have the greatest chance of minimizing human losses from fire while protecting the many conservation values of the region. The Illinois River Basin was chosen because the rural communities in this basin were among the most threatened by the Biscuit fire of 2002.
Detailed information for the Biscuit Fire can be found at the official US Forest Service Biscuit Fire website.
This project is providing spatially explicit scientific foundations for forest management recommendations to sustain and enhance populations of four imperiled carnivores in the Sierra Nevada of California: marten (Martes americana), fisher (Martes pennanti), wolverine (Gulo gulo), and Sierra Nevada red fox (Vulpes vulpes necator). The recommendations focus on enhancing resiliency of existing populations over the next 15-20 years, and assessing strategies for adaptation to climate change in the longer term.
Products include maps depicting habitat value and distribution for each species, lands important to maintaining population connectivity and movement potential between habitat areas, and lands important to accommodating shifts in distribution under climate change. These maps will serve as foundations for spatially explicit conservation, management, and restoration recommendations, which can be incorporated into National Forest Management Plans and other land use and management plans.
In response to the environmental consequences of burning fossil fuels, particularly climate change, and rising energy prices, alternative energy sources are being actively sought throughout the world. Renewable energy sources can help to meet growing energy demands while reducing environmental costs. One widely promoted alternative is biomass energy derived from dedicated biomass crops, as well as from forest and fire management activities. While biomass energy shows some promise as a clean, renewable, and domestic alternative to fossil fuels, it can conflict with critical ecological values and sustainability goals if not properly planned for and implemented. In order to move toward ecological sustainability, biomass energy production must not degrade these important ecological values. However, existing projections of available forest and shrubland biomass resources in the U.S. have not adequately taken these values into consideration.
The Natural Resources Defense Council (NRDC) commissioned CBI to evaluate the effect that ecological constraints would have on estimates of forest and shrubland biomass resources available for energy production in California, as assessed by the California Energy Commission in 2005. California, home to many biologically diverse and unique areas, has been a leader in developing biomass as a potential source of energy as the demand for electrical power continues to rise. The current contribution from biomass to electrical power in California is very small, but current and future biomass resources could be effectively developed to contribute as much as 15 percent of electrical energy demands by 2020. Rapid development of biomass as an energy alternative in California and elsewhere without careful consideration of the overall environmental impact could help achieve climate change abatement goals on the one hand but devastate important biological and ecological values on the other. Accounting for these effects is an initial step towards reducing the environmental impact and risk to important conservation values as biomass development planning and implementation moves ahead. Using available spatial datasets, CBI’s GIS-based analysis quantified and mapped the changes to the current forest and shrubland biomass estimates after accounting for ecological values, such as old growth forest and critical habitat, and the wildland-urban interface.