
Designing landscapes to support biodiversity requires more than adding greenery—it requires restoring the complex networks of species interactions that underpin ecosystem resilience. This principle, known as the reference ecosystem design approach, was the focus of a recent discussion organized by the ASLA Climate & Biodiversity Action Committee.
Chris Cosma, PhD, ecologist with the Conservation Biology Institute, explained that modern development, habitat fragmentation, and climate change have progressively removed “nodes” from ecological networks, contributing to global declines in insects, birds, and other species. Cosma emphasized that landscape architects can play a pivotal role in reversing this trend. By using at least 70% native plants, prioritizing keystone species, and designing for plant, structural, and phenological diversity, designers can reactivate these critical nodes. Additional practices—avoiding pesticides, reducing light pollution, and leaving leaf litter—further enhance habitat function.
Cosma highlighted that these design strategies do more than support biodiversity; they also improve ecosystem services such as air and water quality, carbon sequestration, and human health. His work underscores that thoughtfully designed landscapes can mimic natural processes, creating stable, resilient ecosystems even in urban and suburban environments.
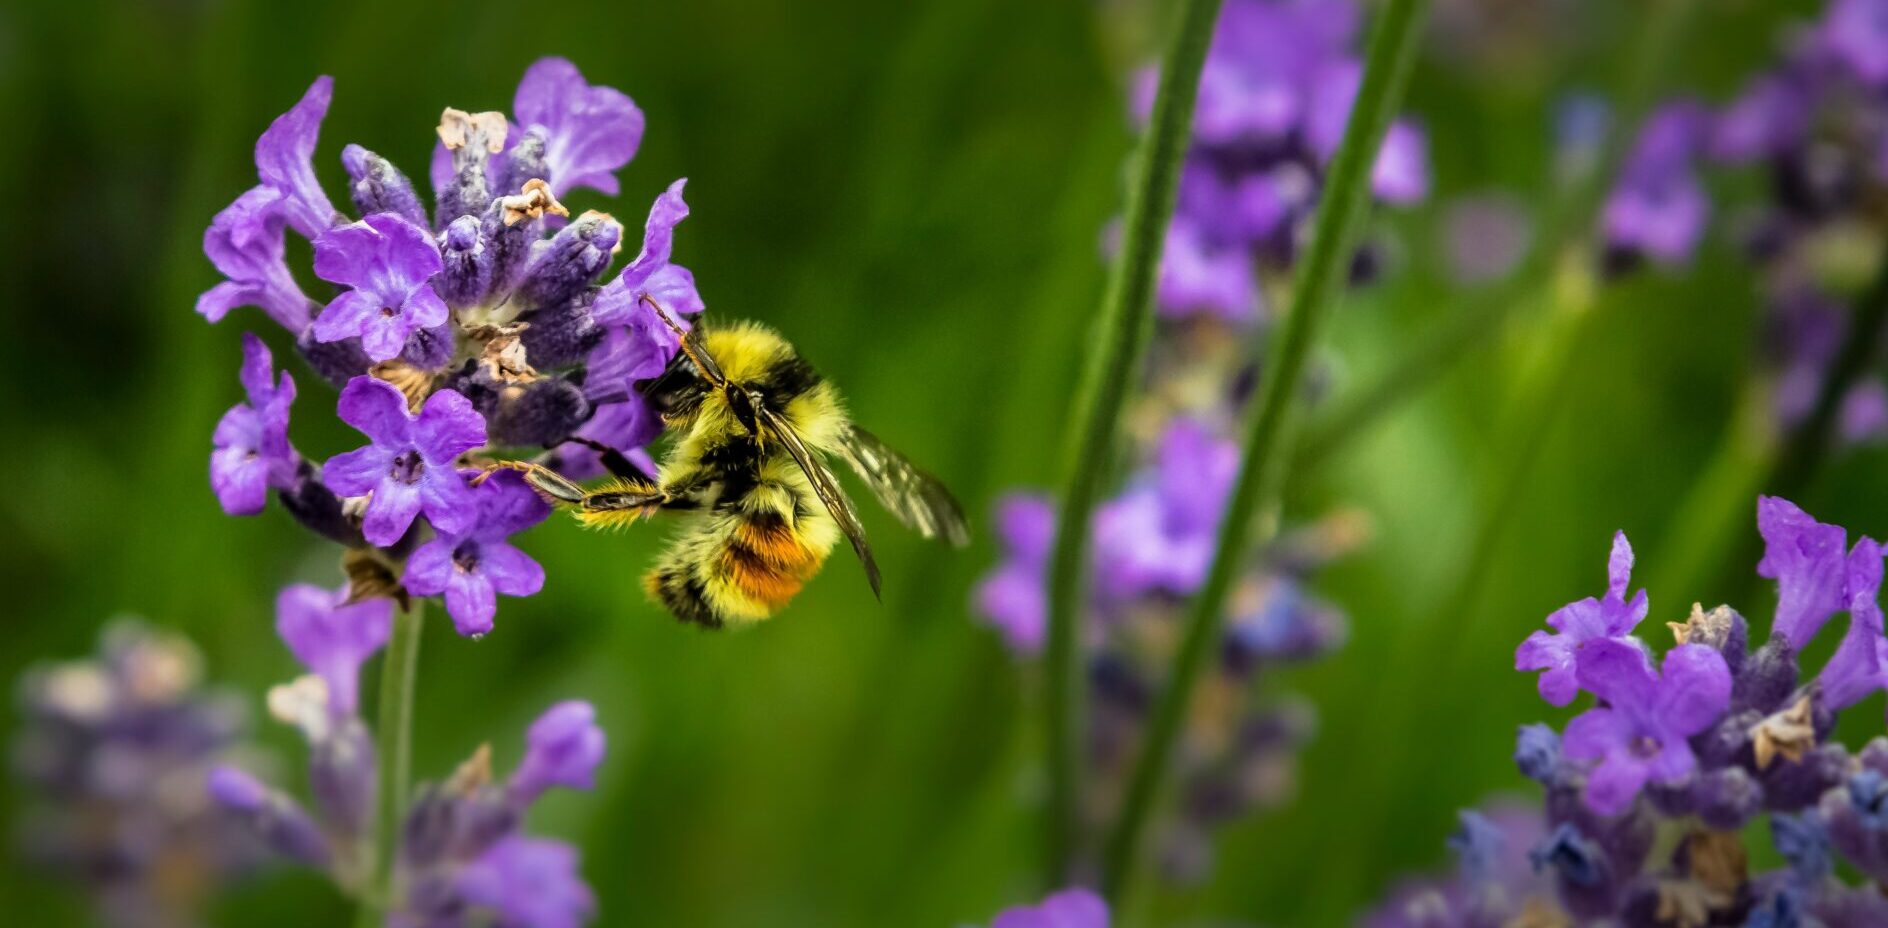
The California Native Plant Society’s Flora Magazine article “A Place for Pollinators” introduces the Pollinator Companion, a novel tool developed by Calscape to support the selection of native plants that enhance pollinator habitats, including species vital for agricultural productivity. This tool addresses global pollinator declines by enabling the creation of targeted habitats—even at small scales—that can serve as ecological corridors for native pollinators.
At the forefront of this initiative is CBI’s very own Dr. Chris Cosma, who played a central role in designing the Pollinator Companion and integration of ecological and pollination datasets into the tool—ensuring that its predictive models for plant-pollinator interactions are scientifically robust. The model leverages over 800,000 observations from the Global Biodiversity Information Facility (GBIF), including museum specimens, herbarium records, and citizen-science contributions, to predict interactions based on geographic distributions, bloom periods, and pollinator activity.
While the current focus is on bees, the model is designed to expand to underrepresented pollinators such as moths, beetles, wasps, and flies. Field validation studies are planned to evaluate the model’s effectiveness relative to traditional planting guides. Cosma’s collaboration with Dr. Laura Melissa Guzman, CNPS, and the California Department of Food and Agriculture (CDFA) combines ecological expertise and large-scale biodiversity data to inform habitat restoration efforts and combat pollinator decline.
The Pollinator Companion represents a major step toward evidence-based native planting, with Cosma’s contributions ensuring its scientific rigor and practical applicability. The tool is accessible via the Calscape website, where users can explore pollinator-focused planting strategies tailored to specific locations and seasons.
In collaboration with Picea, Inc., the Conservation Biology Institute (CBI) conducted a comprehensive natural resource inventory for the Squaxin Island Tribe, located in western Washington at the southern extent of Puget Sound. The inventory focused on local and regional forest resources, emphasizing forest composition and age structure within both tribal lands and the surrounding region.
Using the Data Basin platform, approximately 200 relevant spatial datasets were curated and organized within a secure, private group space accessible to tribal members. As part of the analysis, a land cover update was performed, and forest condition profiles were developed by ownership type—with special attention to tribal lands—and by subwatershed.
The assessment revealed a wide range of forest conditions across the landscape. The resulting inventory is intended to serve as a dynamic, “living” resource, enabling the tribe to make informed management decisions grounded in the best available map-based data and science.
Abstract
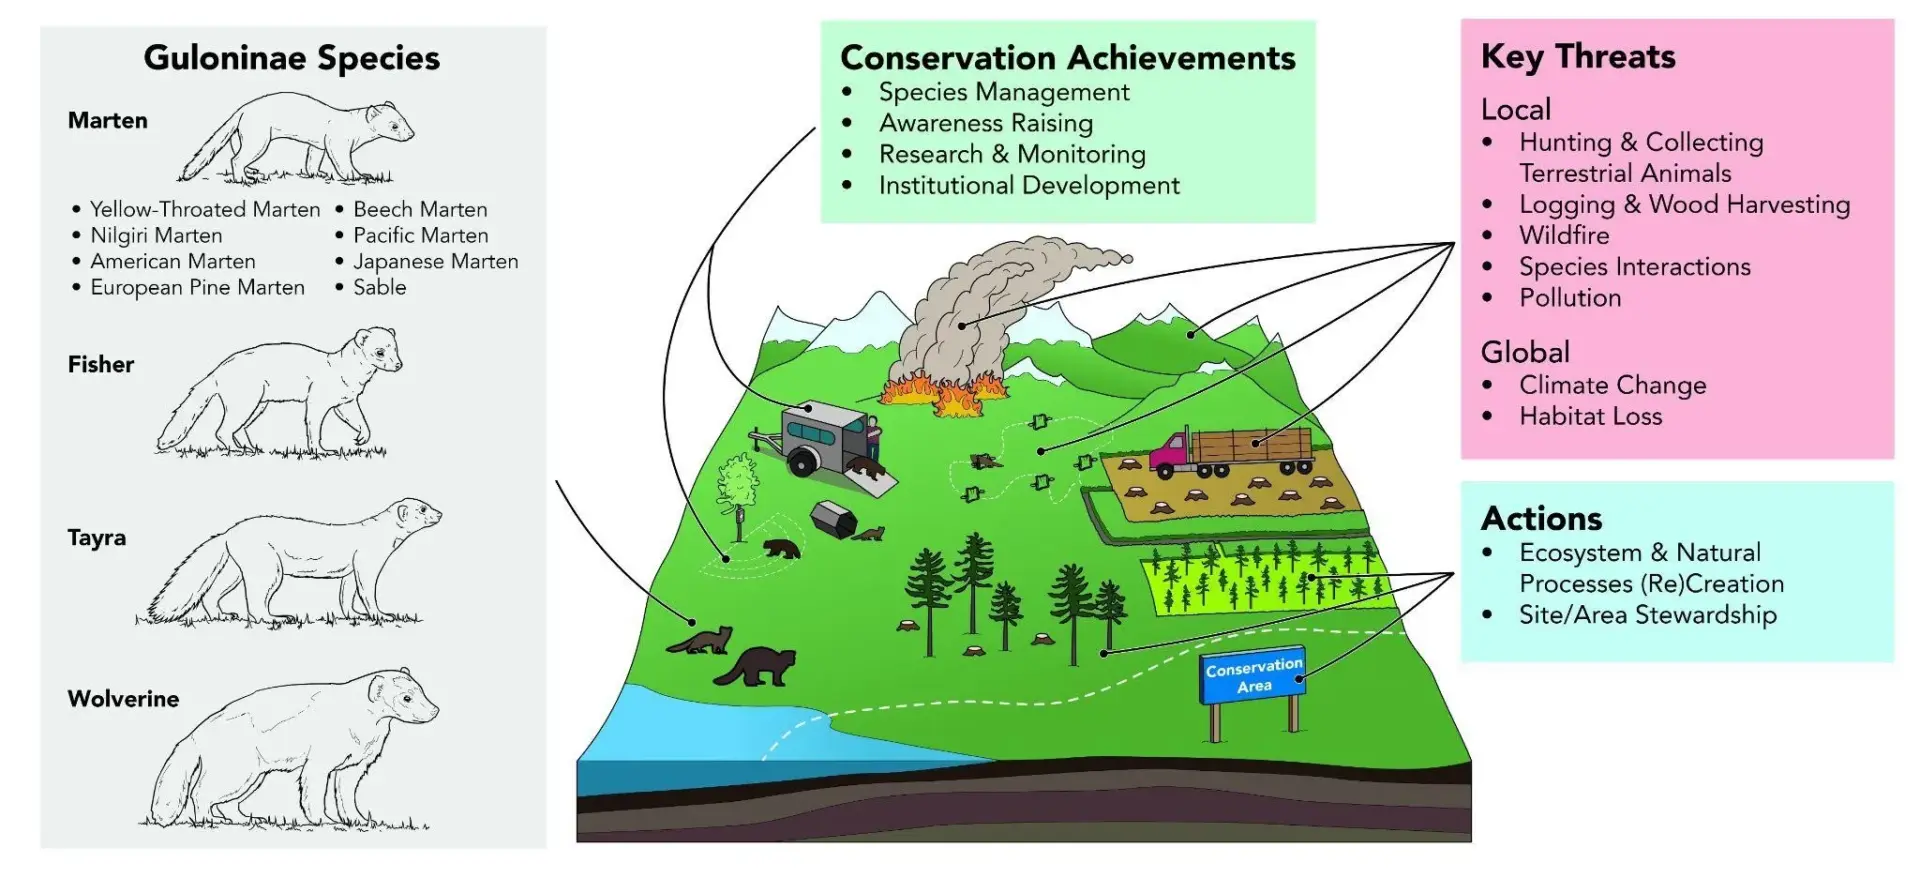
Global biodiversity is declining as human impacts increase and mammals, especially carnivores, are declining particularly quickly. Small carnivores (such as in the Guloninae subfamily) are less frequently considered than large carnivores, despite also being affected by biodiversity declines, because their status and population ecology are exceedingly difficult to assess. Although all but one Guloninae species are globally listed as Least Concern by the International Union for Conservation of Nature (IUCN), this designation obscures conservation challenges and does not include local population declines. Proactive efforts to improve population persistence in regions of most concern may prevent species from becoming globally threatened in the future. We briefly introduce the 11 Guloninae species, highlight collective challenges, and synthesize possible options focused on recovery and conservation. To inform our paper, we conducted a 3-phase process to gather expert opinions: an online survey, an in-person prioritization exercise of online results, and directed in-person group discussions. We focused efforts within the international Martes Working Group consisting of species experts. We followed the IUCN and Conservation Measures Partnership (CMP) threats and actions classifications nomenclature to enable cross-project learning and data aggregation. From our results, the largest described global threat to Guloninae was ‘Climate Change’ (e.g., ecosystem encroachment; changes in temperature regimes) as most Guloninae species appear to have a narrow thermal range where persistence is possible. The largest threat at the jurisdictional level was ‘Biological Resource Use’ (e.g., hunting and collecting terrestrial animals; logging and wood harvesting). The identified action needed to further Guloninae conservation and recovery was ‘Land/Water Management’ (e.g., ecosystem and natural process re-creation; site/area stewardship). We identified unifying themes threatening and benefitting Guloninae; but given the wide geographic range of Guloninae species, the many countries involved, and the diversity of ecosystems with different levels of human impacts, conservation actions need to be locally appropriate. Our paper synthesizes natural history and guidance from experts to provide a foundation for future research efforts and conservation actions for Guloninae conservation.
In 2016, the California Energy Commission funded the Conservation Biology Institute to undertake an advanced landscape condition analysis to use as a foundation for evaluation of ecosystems, species’ habitats, and areas planned for renewable energy development. This was subsequently incorporated into programmatic assessments by multiple State agencies, including the California Department of Forestry and Fire Protection’s Fire and Resource Assessment Program (FRAP 2017 Assessment) and the California Department of Fish and Wildlife’s State Wildlife Action Plan (SWAP 2025 Update).
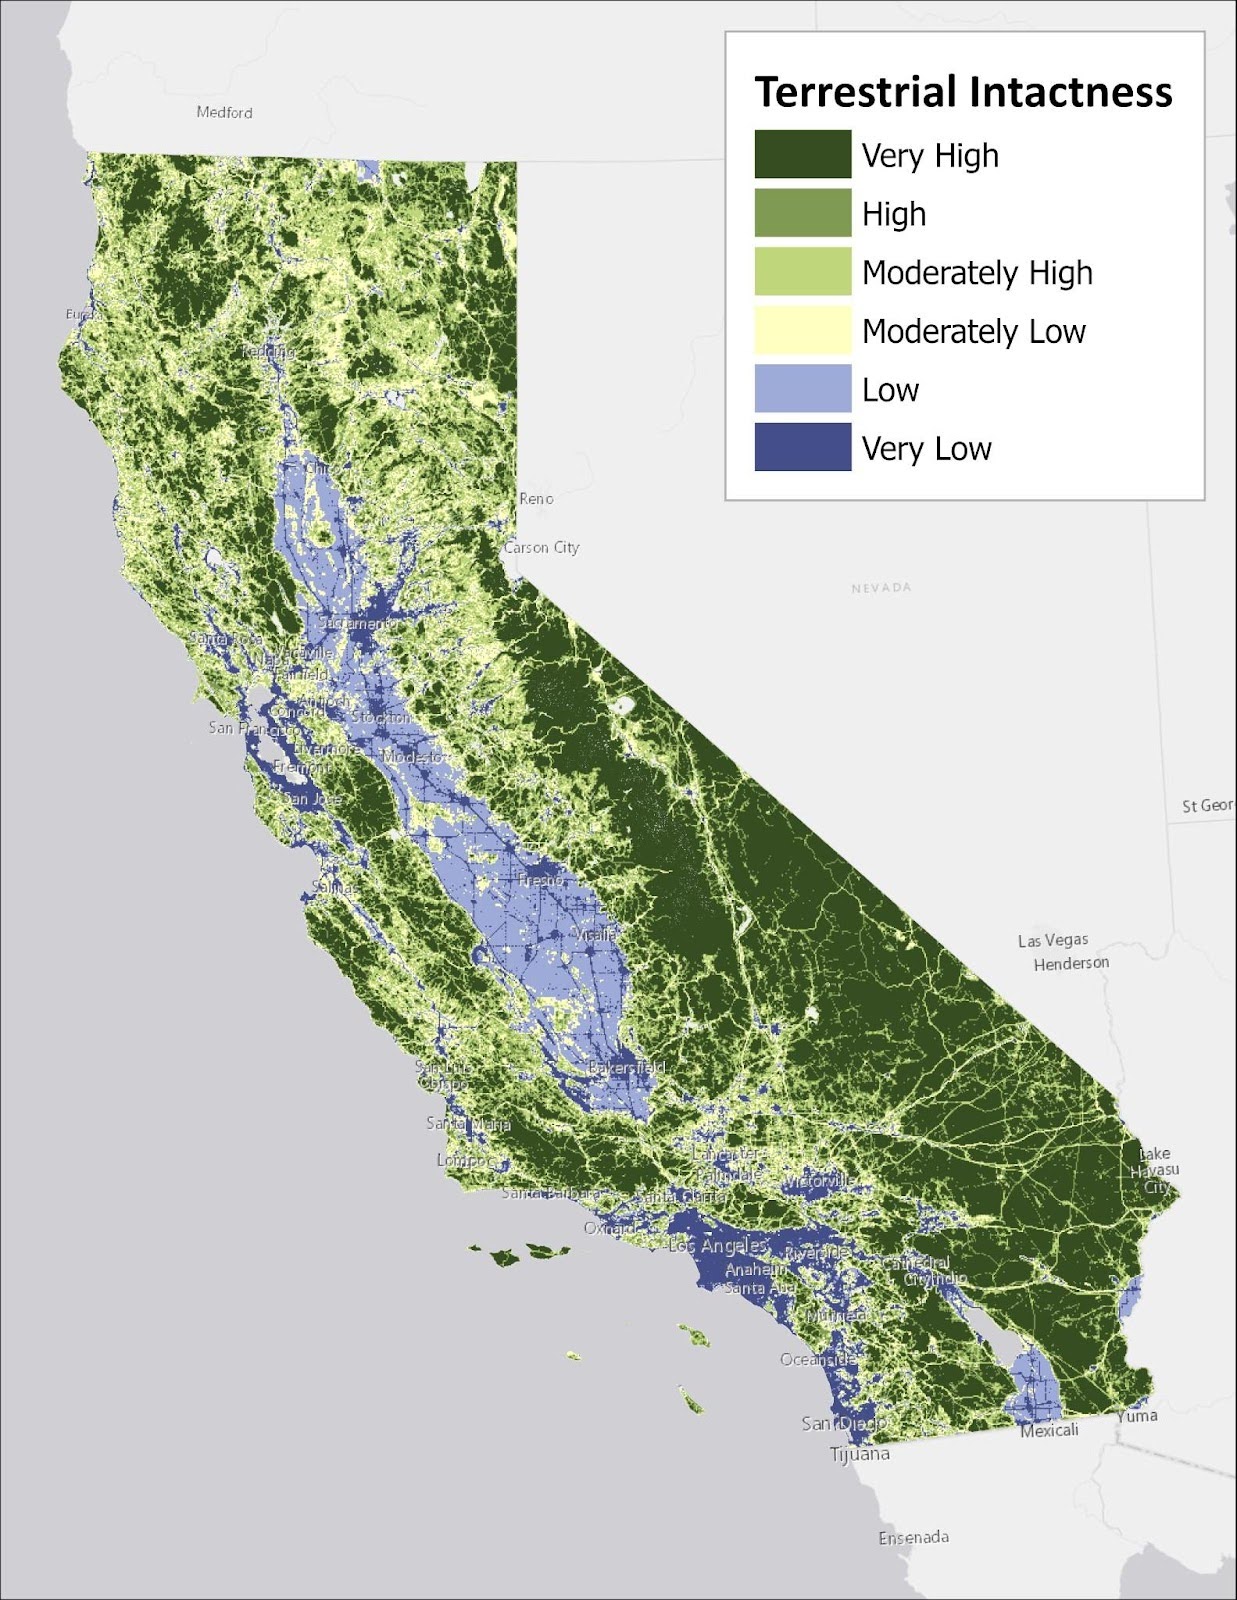
The modeling approach employed by CBI synthesizes complex spatial information into a suite of accessible metrics to quantify terrestrial intactness, an estimate of the naturalness – or lack of human disturbance across the landscape – through a multidimensional lens. The resulting interactive product allows for identification of intact natural areas that maintain ecosystem integrity, thus maximizing support of wildlife and ecosystem services returned to Californians. It also highlights factors affecting the State’s landscape condition, such as infrastructure/urban development, and facilitates understanding the multitude of human impacts co-occurring along that continuum.
In 2024, the California Department of Forestry and Fire Protection (CAL FIRE) funded an update to produce a new version of this terrestrial intactness product, incorporating the most recent data on landscape impacts and providing a more comprehensive view of important considerations with new invasive vegetation and habitat fragmentation metrics. This analysis provides a present-day estimate of the degree to which California’s natural landscapes have been impacted by human disturbance and the drivers at play in any given location. The updated model and accompanying dataset’s comprehensive attribute information can be used for a variety of applications by both agencies and NGOs. These include characterization of intact natural areas that maximize ecosystem services to communities, such as access to nature and improvements in water quality, as well as assessment of ecosystem and species’ habitat condition, considering how various human impacts can be mitigated via strategic planning and targeted restoration efforts.
Significant improvements in data availability and quality inform the updated version of the landscape intactness product, as well as new metrics described above. The 2016 version was limited by lower quality input data and less sophisticated land cover mapping techniques than are currently available. The 2025 version has been crafted with an eye towards incorporating data derived from more advanced methods, likely to be updated at regular intervals, thus setting the stage for products more directly comparable across time. These upgrades and advancements in the analytical platform provide a basis for future work, such as finer resolution modeling that offers additional detail and functionality to the agencies, NGOs, and decision makers using CBI’s products to support scientifically-rigorous management of California’s resources.
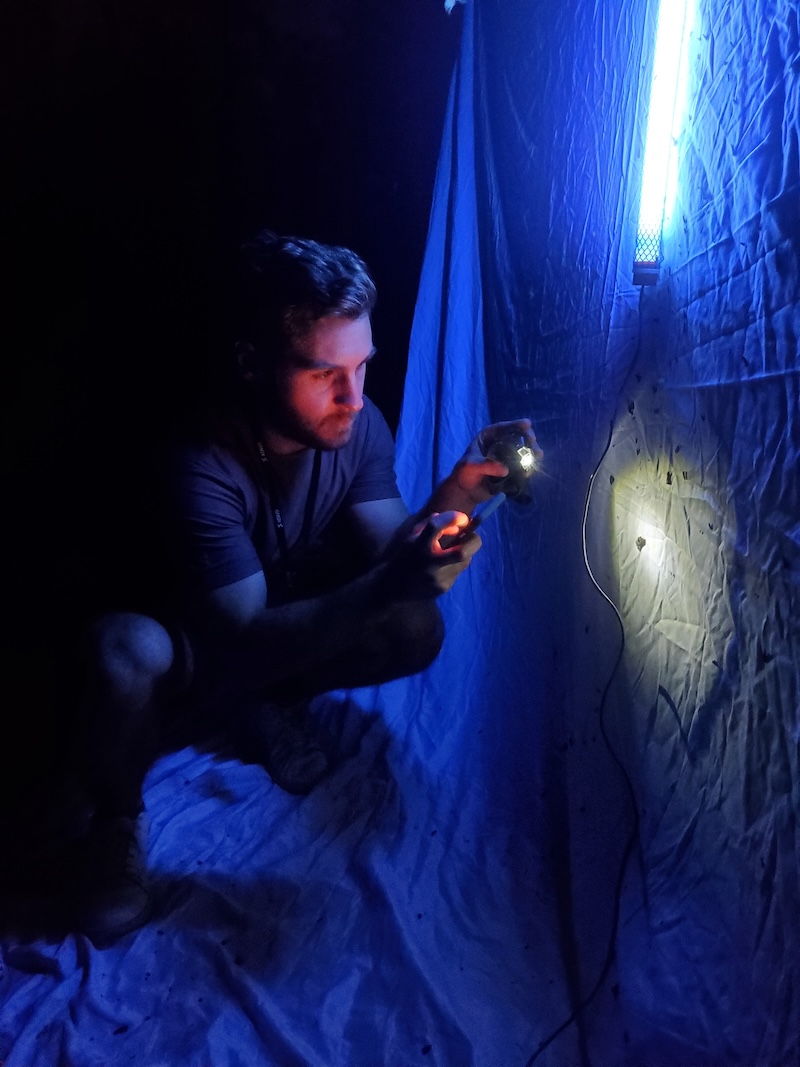
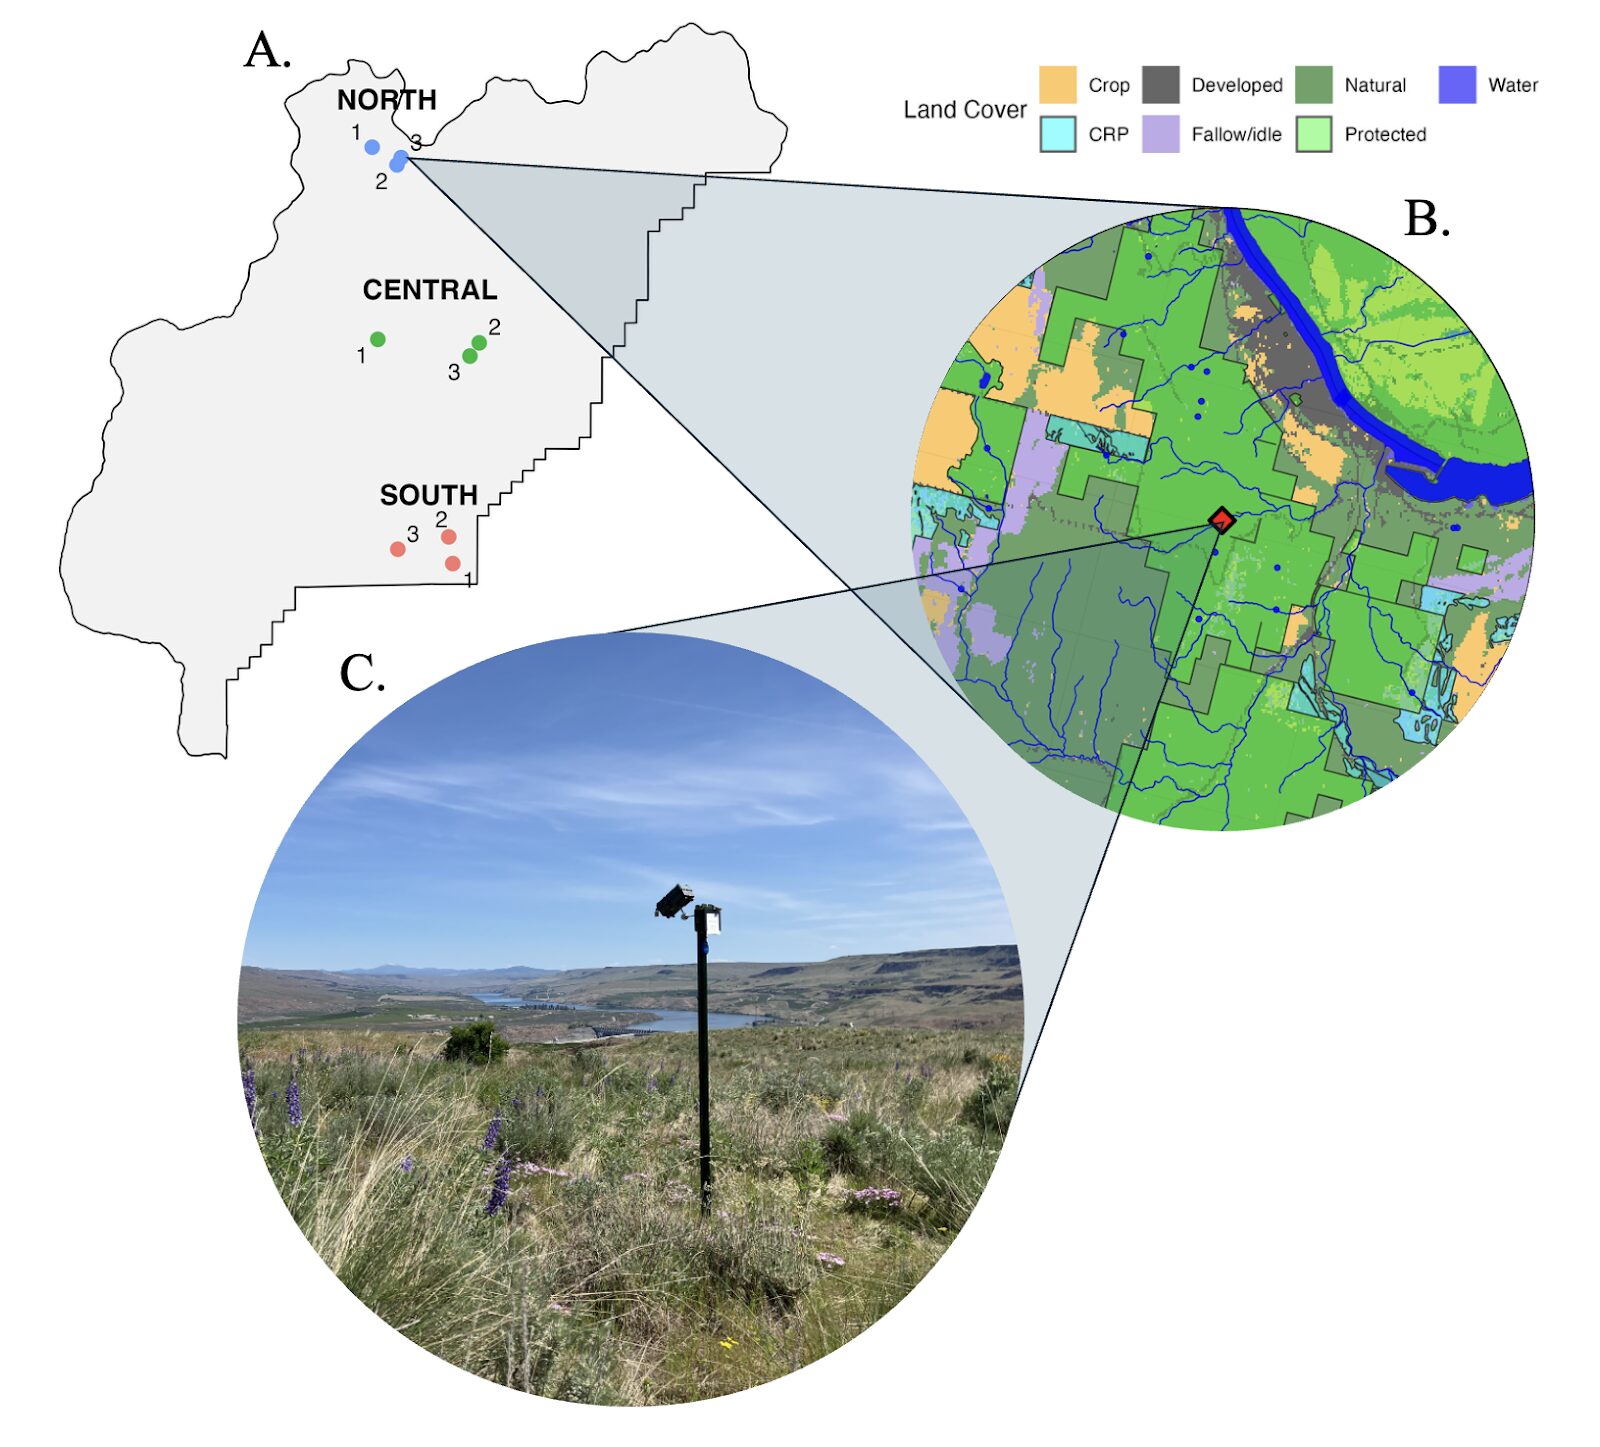
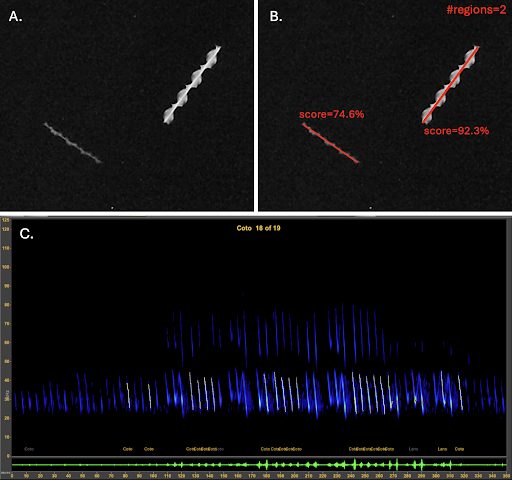
Bats provide critical pest control services in agricultural landscapes, yet agriculture poses significant direct and indirect threats to bats, primarily through habitat alteration and driving insect declines. This project investigated how agroecological land use—including the types of crops, the amount of protected land, and habitat restoration through the USDA Conservation Reserve Program (CRP)—affects bat activity and diversity in the Columbia Plateau ecoregion of Eastern Washington, focusing on the state candidate species, Townsend’s big-eared bat (Corynorhinus townsendii), and other bat species of conservation concern.
We deployed acoustic monitors to monitor bats and camera traps to monitor nocturnal flying insects across nine protected sites (BLM and WDFW) in Douglas County from July–October 2024 and March–June 2025, spanning 163 monitoring nights. These sites represented a gradient of surrounding land types—cropland, CRP restoration, and protected natural habitat. Using generalized linear mixed-effects models, we analyzed how bat activity, species richness, diversity, and feeding behavior were influenced by environmental variables including climate, land cover, water features, and nocturnal flying insect abundance.
Key Findings
We recorded all 14 bat species expected in the region, including all Washington State Species of Greatest Conservation Need (SGCN) expected in the region. We detected C. townsendii 19 times across six of nine sites and all three study regions. Temperature emerged as the dominant environmental driver of bat activity, with both short-term nightly temperatures and long-term minimum temperatures strongly predicting bat diversity, activity, and feeding intensity.
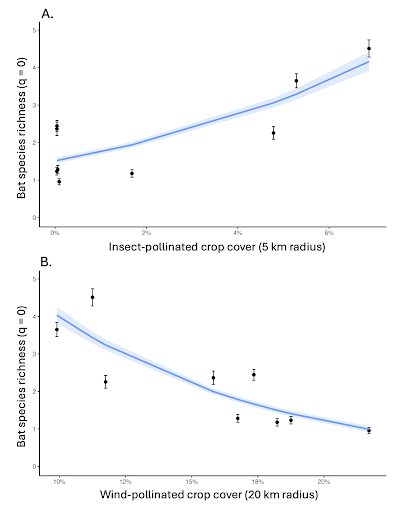
Agricultural practices showed contrasting effects on bat communities. Insect-pollinated crops and greater crop diversity within 2–5 km were strongly associated with increased bat diversity and activity, particularly benefiting C. townsendii and other moth specialists, while more wind-pollinated crops at 20 km scales were associated with decreased bat diversity and activity. Bat activity, diversity, and foraging showed consistent negative relationships with CRP land across multiple spatial scales and CRP practices, including permanent grass plantings (CP1, CP2) and wildlife enhancements (CP38E).
Protected areas increased the chances of detecting several species, including C. townsendii. The presence of more springs and seeps had positive effects on total bat diversity and activity, underscoring the importance of water features for bats. Nocturnal insect abundance showed modest but significant effects on bat feeding activity, with fine-scale temporal correlations observed throughout the night.
Management Implications
These findings indicate that diverse bat communities, including vulnerable species like C. townsendii, are an active and important component of the agricultural landscapes of Eastern Washington. The positive associations between bats and diverse insect-pollinated crops suggests that diversified agricultural systems may provide more valuable foraging habitat than simplified agricultural systems composed primarily of cereal grains, and perhaps more even than grassland restoration through the CRP. Indeed, although they warrant further investigation, our results suggest that in order to better support bats, the CRP should strive to encompass habitat types and landscape features, such as water sources, that bats and their insect prey rely on. Furthermore, our results highlight that maintaining and expanding protected areas, particularly those that include water sources, is critical for the conservation of rare and vulnerable species like C. townsendii in agricultural landscapes.
Recommendations
- Expand protected areas in key habitat areas for C. townsendii and other rare and vulnerable bat species
- Prioritize conservation efforts for C. townsendii in northern Douglas County, where the species mostly occurs
- Prioritize protection and restoration of springs, seeps, and other point water sources in agricultural landscape conservation planning
- Investigate additional factors (e.g., contract age) that may affect the value of CRP land to bats, and reevaluate CRP habitat management practices to incorporate habitat features that better support bats and their insect prey
- Encourage diverse crop rotations that include insect-pollinated species
- Implement long-term monitoring programs using validated passive acoustic and camera-based techniques
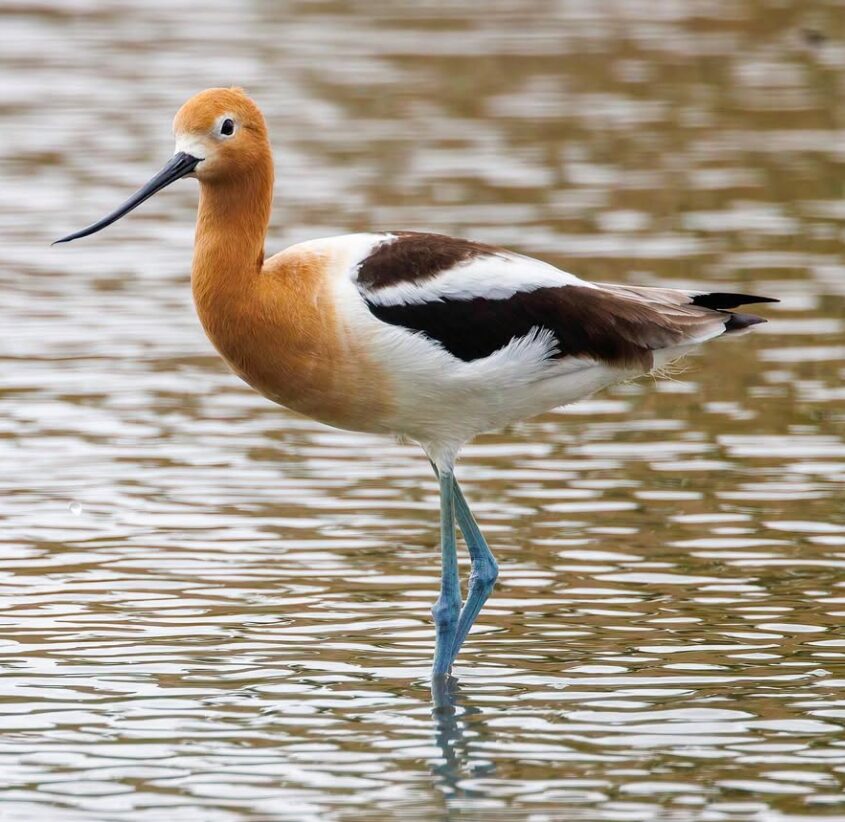
Because of the importance of the Central Valley of California to shorebirds along the Pacific Flyway, considerable conservation investments have been made in the area’s agricultural fields and managed wetlands. Through their BirdReturns and Bid4Birds programs, The Nature Conservancy and the California Ricelands Waterbird Foundation pay rice farmers to flood fields to decompose post-harvest rice thatch and, in doing so, create habitat for shorebirds. Previous research by CBI and The Nature Conservancy researchers found that shorebird density (birds/hectare) increased with earlier fall flooding and in fields managed to be approximately 50% flooded, 5-10 cm deep, and with minimal straw or stubble cover in fall. Lower soil clay content and flooding consistency – either at a site that is continually flooded over many months or a site that has been flooded in previous years – was also associated with higher shorebird density. Finally, the team found preliminary evidence that fields flooded by groundwater, instead of surface water, were associated with higher shorebird density. These findings are important for guiding continued shorebird management in agricultural landscapes.
Combining the five years of data on shorebird abundance used in the original study with an additional five years of more recent data, we are going to expand our preliminary analysis on the importance of water source on shorebird abundance. Specifically, we are going to explore whether more shorebirds are found in fields flooded with surface water versus groundwater. Assuming that shorebirds prefer groundwater in the expanded analysis, our next priority is to explore why, where our first hypothesis is water quality. Using a number of public resources that sample groundwater quality (nitrates, sodium, and arsenic) and surface water quality (pH, turbidity, temperature, conductance, and dissolved oxygen), we will explore whether shorebird abundance is associated with any of these water metrics. Determining the best practices for habitat creation in agricultural landscapes is critically important for conservation and recovery of declining shorebird populations.
Providing Tools for USDA Monitoring and Assessment
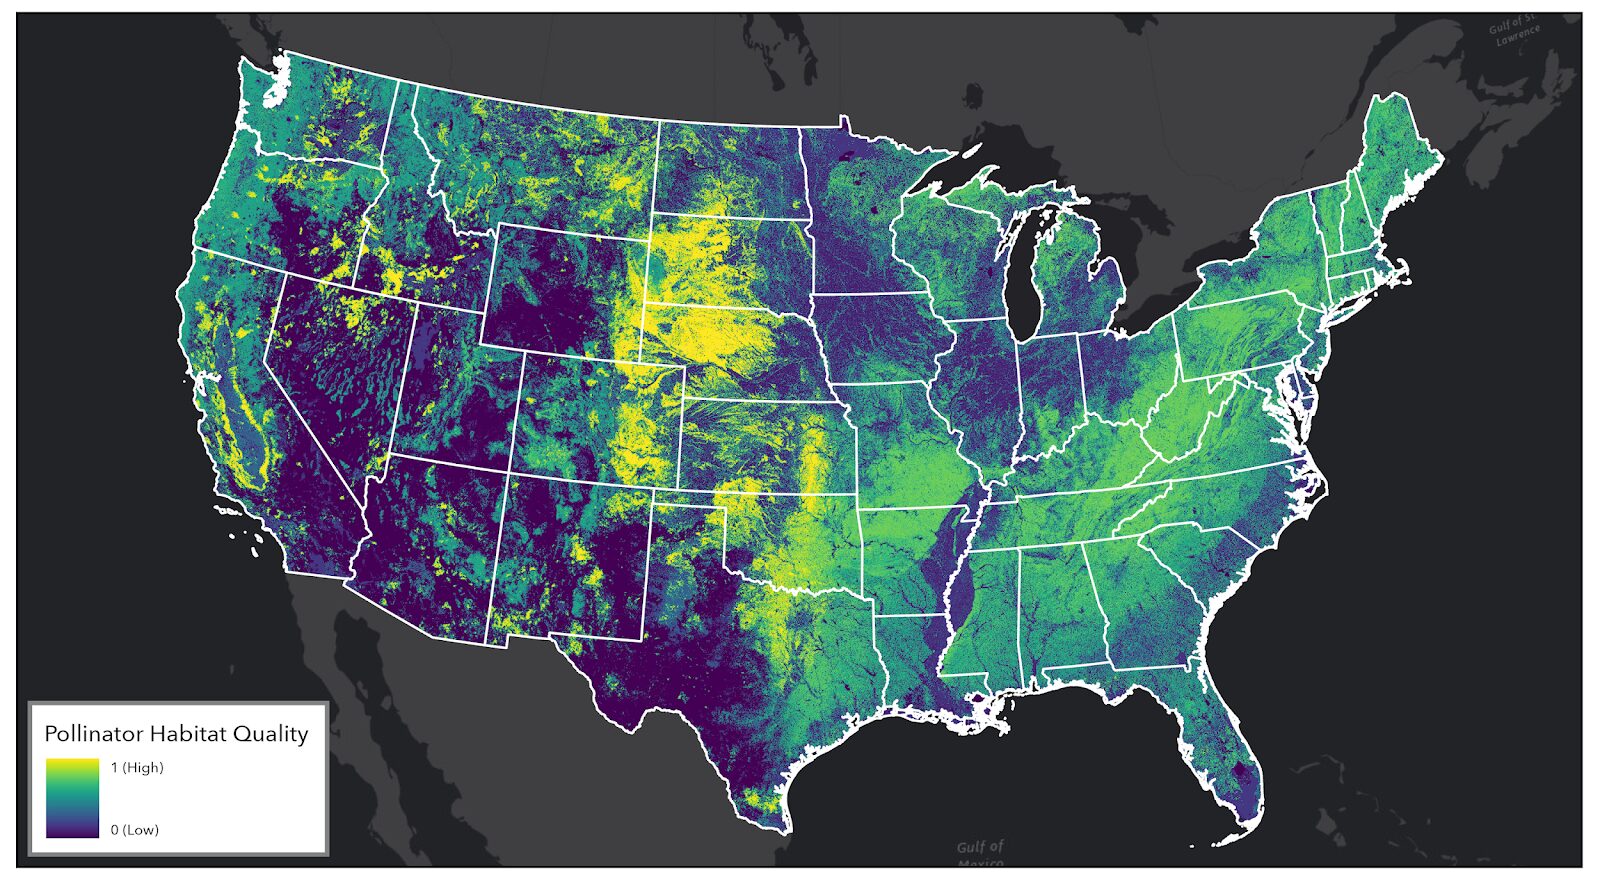
CBI is using the latest remote sensing, machine learning, and modeling approaches to assess the quality of grasslands and pollinator habitat. Outputs from this analysis will be delivered to USDA through an online-decision support system, designed and built by CBI, called the USDA Conservation Toolkit. This suite of map-based tools will support the USDA Conservation Reserve Program (CRP) and other land-based conservation and restoration programs operating across the United States. CRP currently covers ~24.8 million acres of working lands nationwide.
Goal: Assess ecosystems services across the CRP portfolio
- Generate products to support USDA policies and program initiatives
- Provide actionable conservation intelligence
Targets
- Quantify foundational supporting ecosystem services across CRP enrollments
- Grasslands ecosystem quality
- Pollinator habitat quality
- Incorporate resulting spatial data and metrics into online applications, allowing for program reporting at multiple scales
- A priority for this effort is to quantify the CRP national portfolio return on investment, screening enrolled farms, and assessing at state, regional and national scales
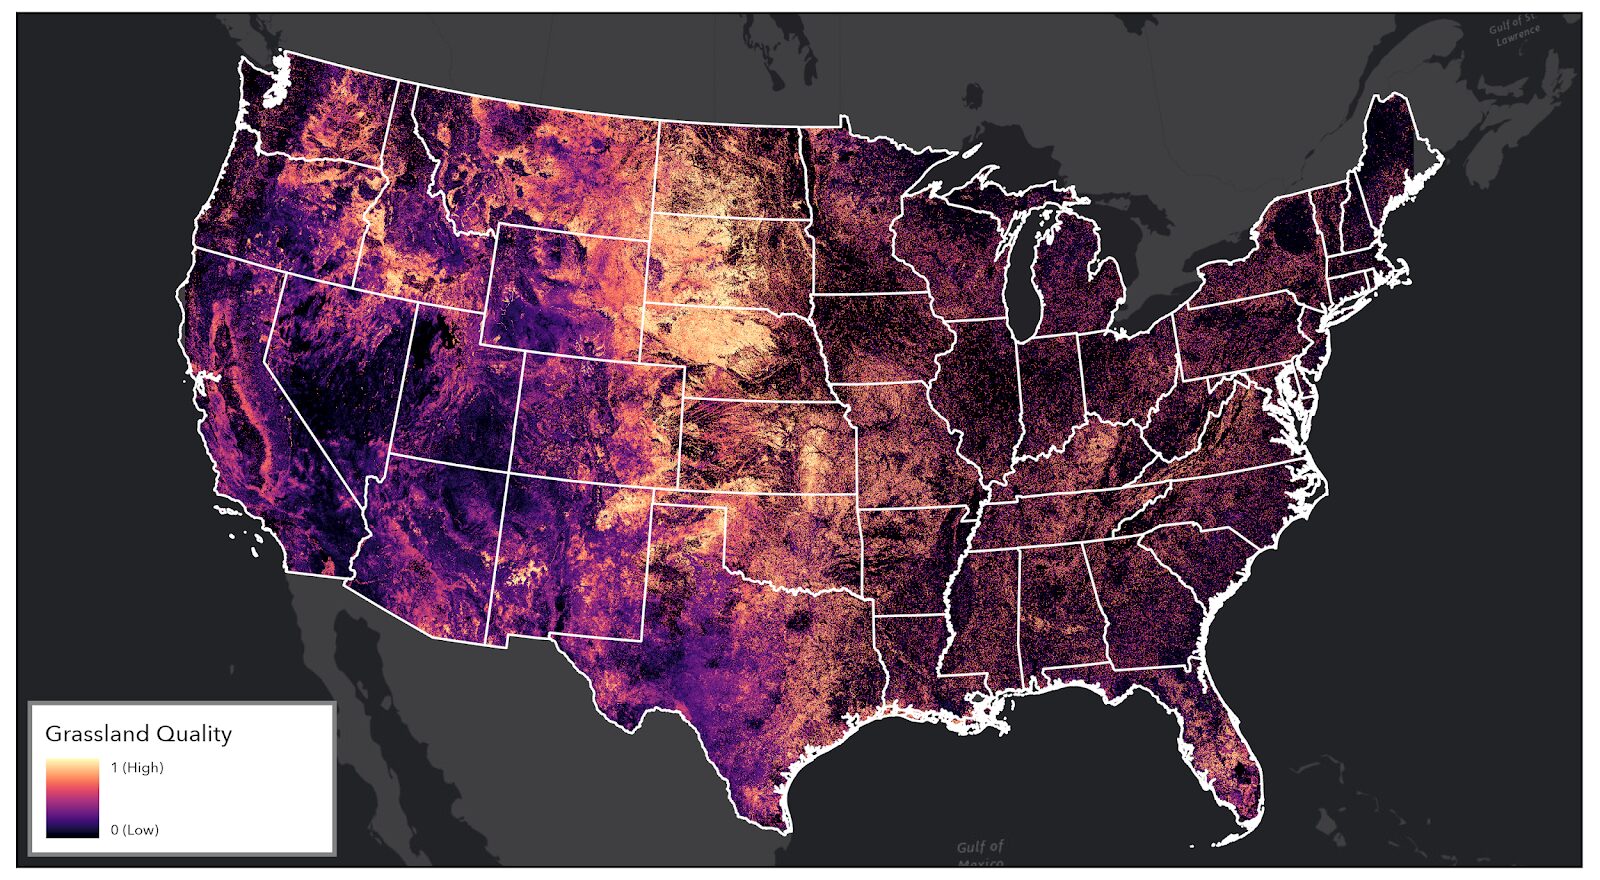
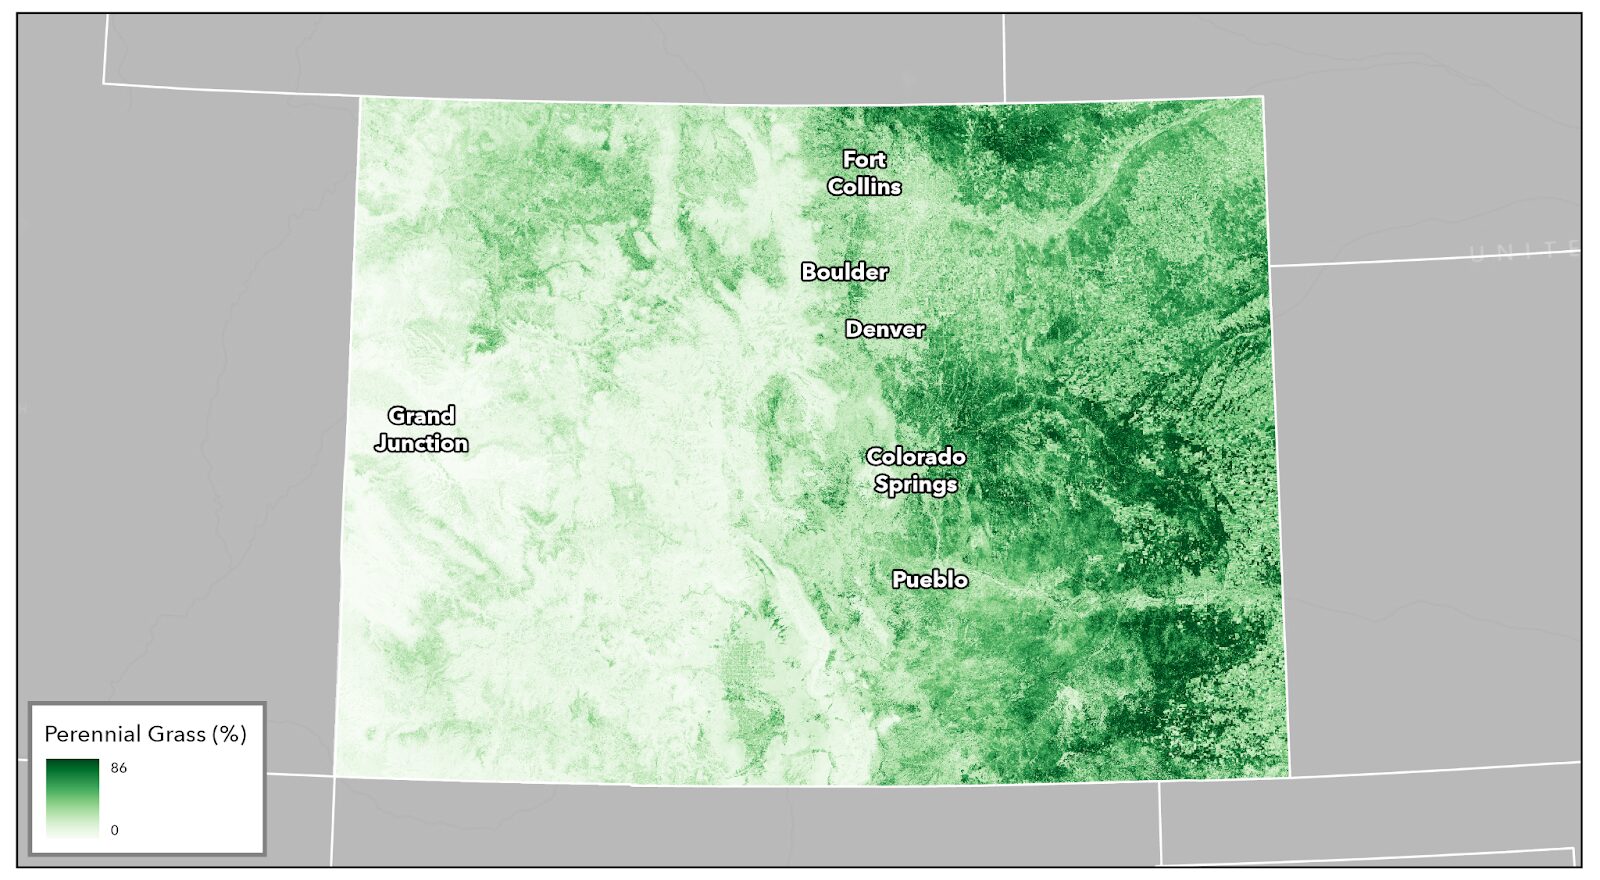
CBI CRP Grassland Quality Model – Overview
Components
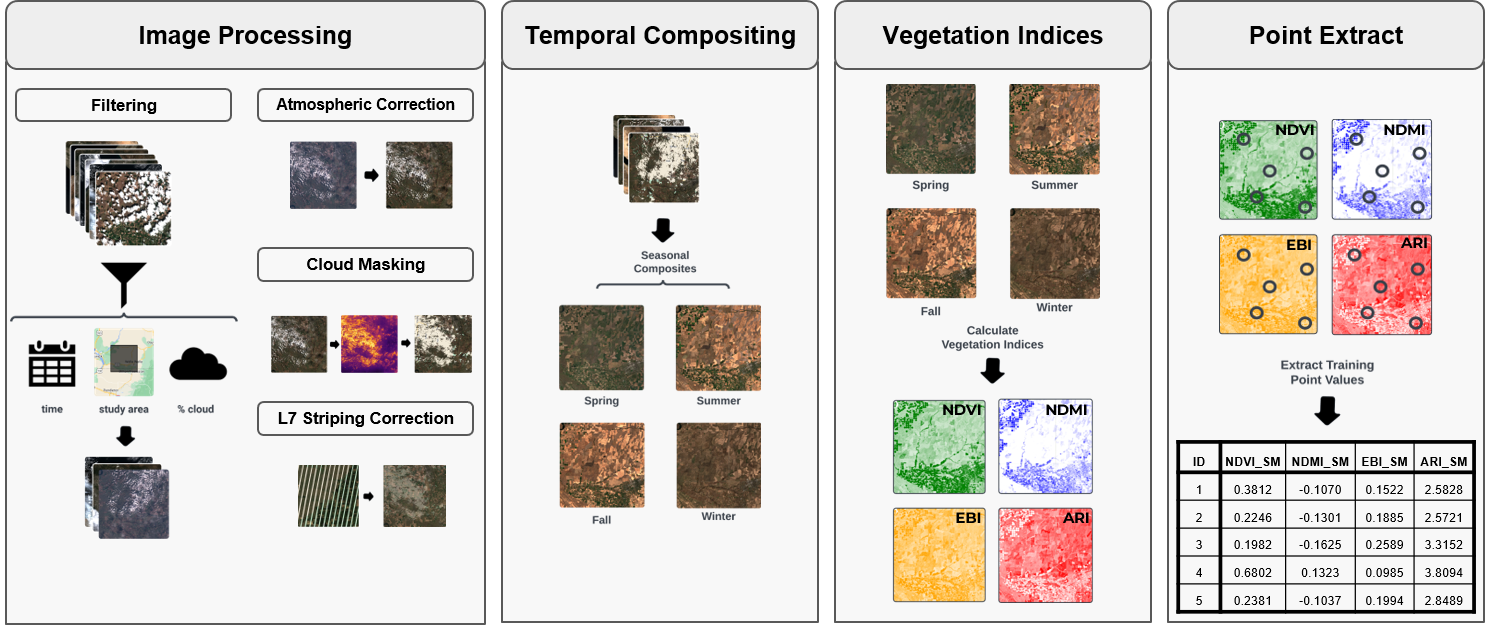
- Integrative, comprehensive approach to modeling using the best available spatial data and remotely sensed metrics (e.g. National vegetation surveys, NLCD, Rangeland Analysis Platform (RAP), custom CBI products)
- Leverages outputs from the Google Earth Engine (GEE) cloud-computing platform with CBI’s customized library of 200+ vegetation indices
What does it tell us?
- Indicator for ecosystem health, form, function, and supporting services strength, based on the USDA grassland operational definition (USDA-NRCS 2024, National Resources Inventory Grazing Land On-Site Data Collection Handbook)
- Complements existing frameworks (Rangeland Health Assessment) and other modeling efforts (RAP, K. Barnes 2024)
What does it offer USDA?
- Multi-scale (non-monetary), valuation of ecosystem condition for CRP enrolled lands and surrounding landscape
- Insights on baseline field-level condition and landscape-level spatial analytics for CRP assessment and reporting
- Illustrates CRP return on investment at a programmatic scale and quantifies enrolled land performance with nuanced metrics
How is it unique?
- Hierarchical measure of grassland ecosystem vigor, community composition, and resilience
- Expandable framework produces multidimensional metrics to quantify patterns across the landscape
- Summarizes information across CRP farms and practices
- Offers insights on baseline current state and local condition at multiple scales
Pollinator Habitat Quality Model – Overview
Components
- Integrative, comprehensive approach to modeling using the best available spatial data and remotely sensed metrics (e.g. US National Phenology Network, NLCD, Rangeland Analysis Platform (RAP), NatureServe Explorer, custom CBI products)
What does it tell us?
- Describes pollinator natural resource needs and spatial use of the landscape
- Indicator for pollinator population health and pollination service strength
- Spatial complement to on-ground pollinator assessments funded by USDA
What does it offer USDA?
- Multi-dimensional, non-monetary valuation of pollinator habitat
- Foundation for field to landscape-level spatial analytics for CRP assessment and reporting
- Illustrates CRP return on investment at a programmatic scale and quantifies enrolled land performance with nuanced metrics
How is it unique?
- Builds on the benchmark InVest© model framework
- Informed by 300,000 bee observations from the Global Biodiversity Information Facility (GBIF)
- Innovations for bee flight, nesting, and floral suitability estimates
A miraculous recovery of the Yellowstone National Park ecosystem, due to the reintroduction of wolves, has completely reshaped the northern range through a trophic cascade – changes at the top of the food chain having a domino effect down the entire ecosystem. Check out these two articles featuring CBI’s William Ripple!
Wolves Transform Yellowstone’s Landscape: 1,500% Growth in Riverside Plants Shows Nature’s Comeback
“Our findings emphasize the power of predators as ecosystem architects,” said William Ripple from Oregon State University, who led the research. “The restoration of wolves and other large predators has transformed parts of Yellowstone, benefiting not only willows but other woody species such as aspen, alder, and berry-producing shrubs.”
Restoring predators, restoring ecosystems: Yellowstone wolves and other carnivores drive strong trophic cascade
The research, which utilized previously published data from 25 riparian (streamside) sites and collected over a 20 year period, from 2001 to 2020, revealed a remarkable 1,500% increase in willow crown volume along riparian zones in northern Yellowstone National Park, driven by the effects on elk due to a restored large carnivore guild following the reintroduction of wolves in 1995–96, and other factors. The study was led by Dr. William J. Ripple of Oregon State University and the Conservation Biology Institute in Corvallis, OR, and published in Global Ecology and Conservation.
Abstract
Trophic cascades, the indirect effects of predators propagating downward through food webs, play a critical role in shaping ecosystems. We evaluated the strength of a large carnivore-induced trophic cascade in northern Yellowstone National Park, focusing on riparian willows (Salix spp.) as primary producers. Using the log10 response ratio, a standardized indicator of trophic cascade strength, we quantified changes in willow crown volume following the 1995–96 reintroduction of gray wolves (Canis lupus), which completed the large carnivore guild. Reduced herbivory pressure from Rocky Mountain elk (Cervus canadensis) followed their reintroduction, leading to increased growth in willows. Crown volume, a proxy for above-ground biomass, was calculated using a predictive model based on willow height and was used to index primary producer response. Data from a 20-year study (2001–2020) revealed a relatively strong trophic cascade, with a ∼1500 % increase in average willow crown volume and a log10 ratio of 1.21. This ratio surpassed 82 % of those reported in a global meta-analysis of trophic cascades. These results emphasize the importance of long-term monitoring to capture gradual and nonlinear ecosystem responses following predator reintroductions. They also underscore the substantial effect restored large carnivores can have on riparian vegetation and highlight the utility of crown volume as a metric for assessing trophic cascade strength.