Felidae Conservation Fund, Bay Area Puma Project, and Conservation Biology Institute co-produce an analysis and project to improve the connection to and from Mount Diablo
Description
The project aims to address the pressing issue of habitat fragmentation and lack of connectivity for mountain lions in the East Bay Diablo Range of the San Francisco Bay Area in California. The current situation poses a significant risk of inbreeding and local extinctions among these iconic predators, further threatening the fragile biodiversity of the region.To tackle this challenge, our project will identify potential linkages and barriers to movement for mountain lions, with the goal of establishing evidence-based conservation strategies. We will employ cutting-edge connectivity modeling and mapping techniques. We will also utilize state-of-the-art remote-sensing camera arrays to capture and analyze wildlife movement patterns in the East Bay Diablo Range. These camera arrays will provide valuable data to ground-truth linkage models, allowing us to accurately identify potential corridors and barriers for mountain lion movement. By combining cutting-edge modeling techniques and technology with on-the-ground fieldwork, we will enhance the precision and effectiveness of our conservation strategies, ensuring that our efforts are grounded in robust scientific evidence.
By identifying and restoring crucial corridors, we aim to mitigate the adverse effects of habitat isolation, promote gene flow, and safeguard genetic diversity among mountain lion populations. This, in turn, will contribute to the overall health and resilience of the East Bay Diablo Range ecosystem.
The project’s success will rely on a multidisciplinary approach, combining scientific research, community involvement, and policy advocacy. By addressing the challenges of habitat fragmentation and promoting connectivity, we aim to ensure the long-term persistence of mountain lions in the East Bay Diablo Range while preserving the rich biodiversity that characterizes this unique region.
Overall, this project represents a vital opportunity to protect and restore critical habitats, prevent local extinctions, and secure the future of mountain lions in the San Francisco Bay Area. By investing in the conservation of these iconic predators, we will safeguard the ecological integrity of the East Bay Diablo Range and also enhance the overall health and resilience of the region for generations to come.
The Project Page for this is periodically updated, and is currently located at
https://felidaefund.org/projects/research/pumalink
The current version of the Haying and Grazing (H&G) tool allows USDA staff to process emergency and non-emergency H&G requests, approve and certify them, and access them easily for reports.
This version has been designed to assist staff and reduce workloads when the landowner comes into the field office to make a request. In future versions, USDA may decide to make the entire process digital, and allow landowners to submit requests, digitally sign and certify approved requests from their homes.
CBI is building state-of-art, user-driven tools for the USDA CRP program to streamline workflows and improve cost efficiency
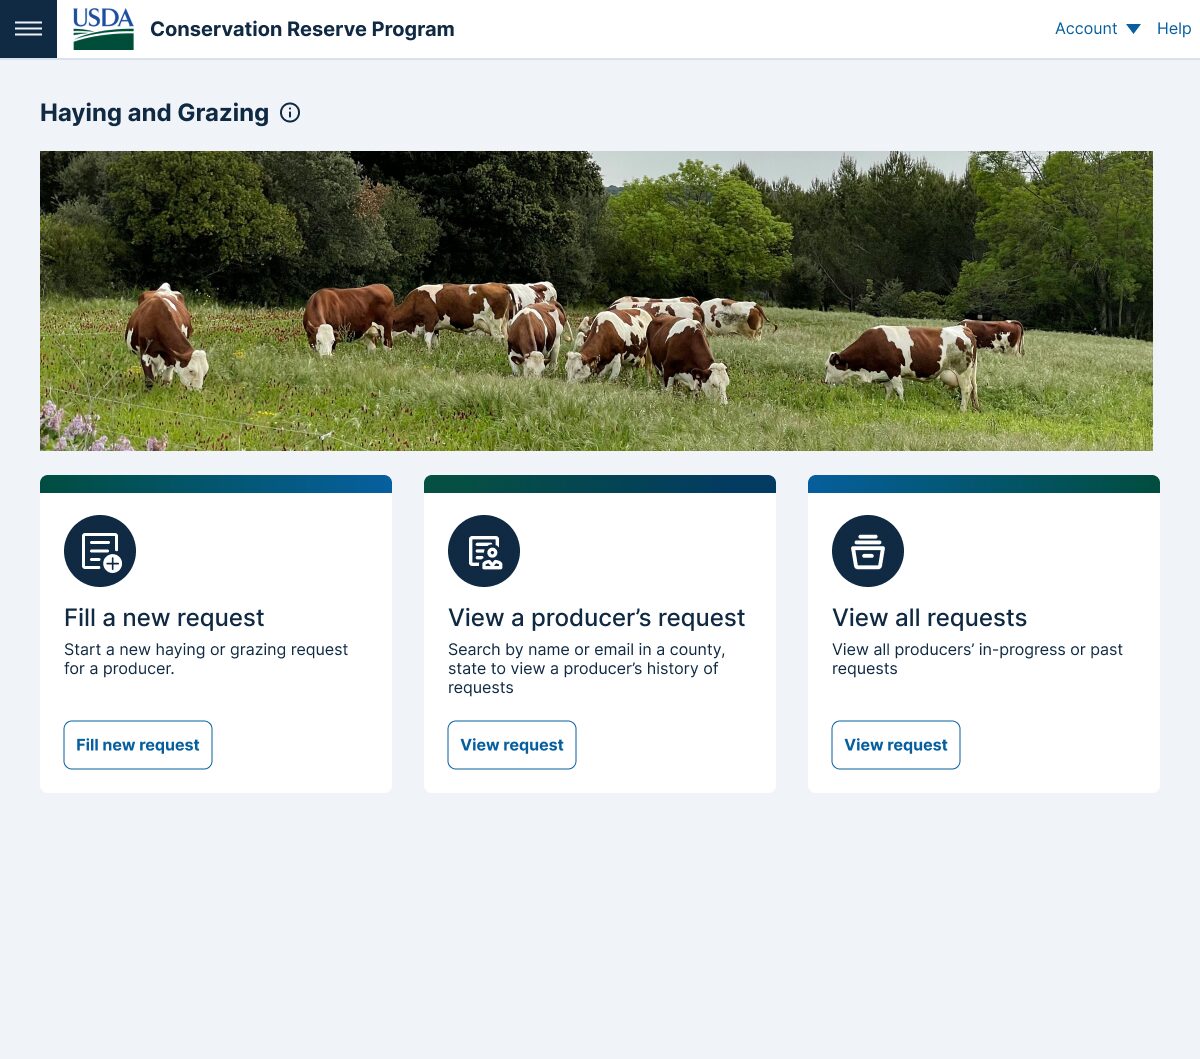
The pilot H&G tool is available to USDA staff and they will need to contact Cole or Justin at CBI to be registered in a secure system to access the tool.
Rapid assessment of vegetation cover and quality designed for CRP Landowners and Farmers.
The USDA Mobile Field App allows producers to provide a quick status check of their fields contracted under the Conservation Reserve Program (CRP). It also provides valuable validation data improving the accuracy of assessments based on remote sensing and machine learning. It can be easily customized for other vegetation assessments. It is currently designed to help improve communication between producers and USDA staff, and aid in easy reporting and record keeping.
CBI in partnership with producers and USDA Staff designed and built an easy-to-use field app that takes 10 minutes to get an accurate assessment of vegetation cover and quality of CRP fields
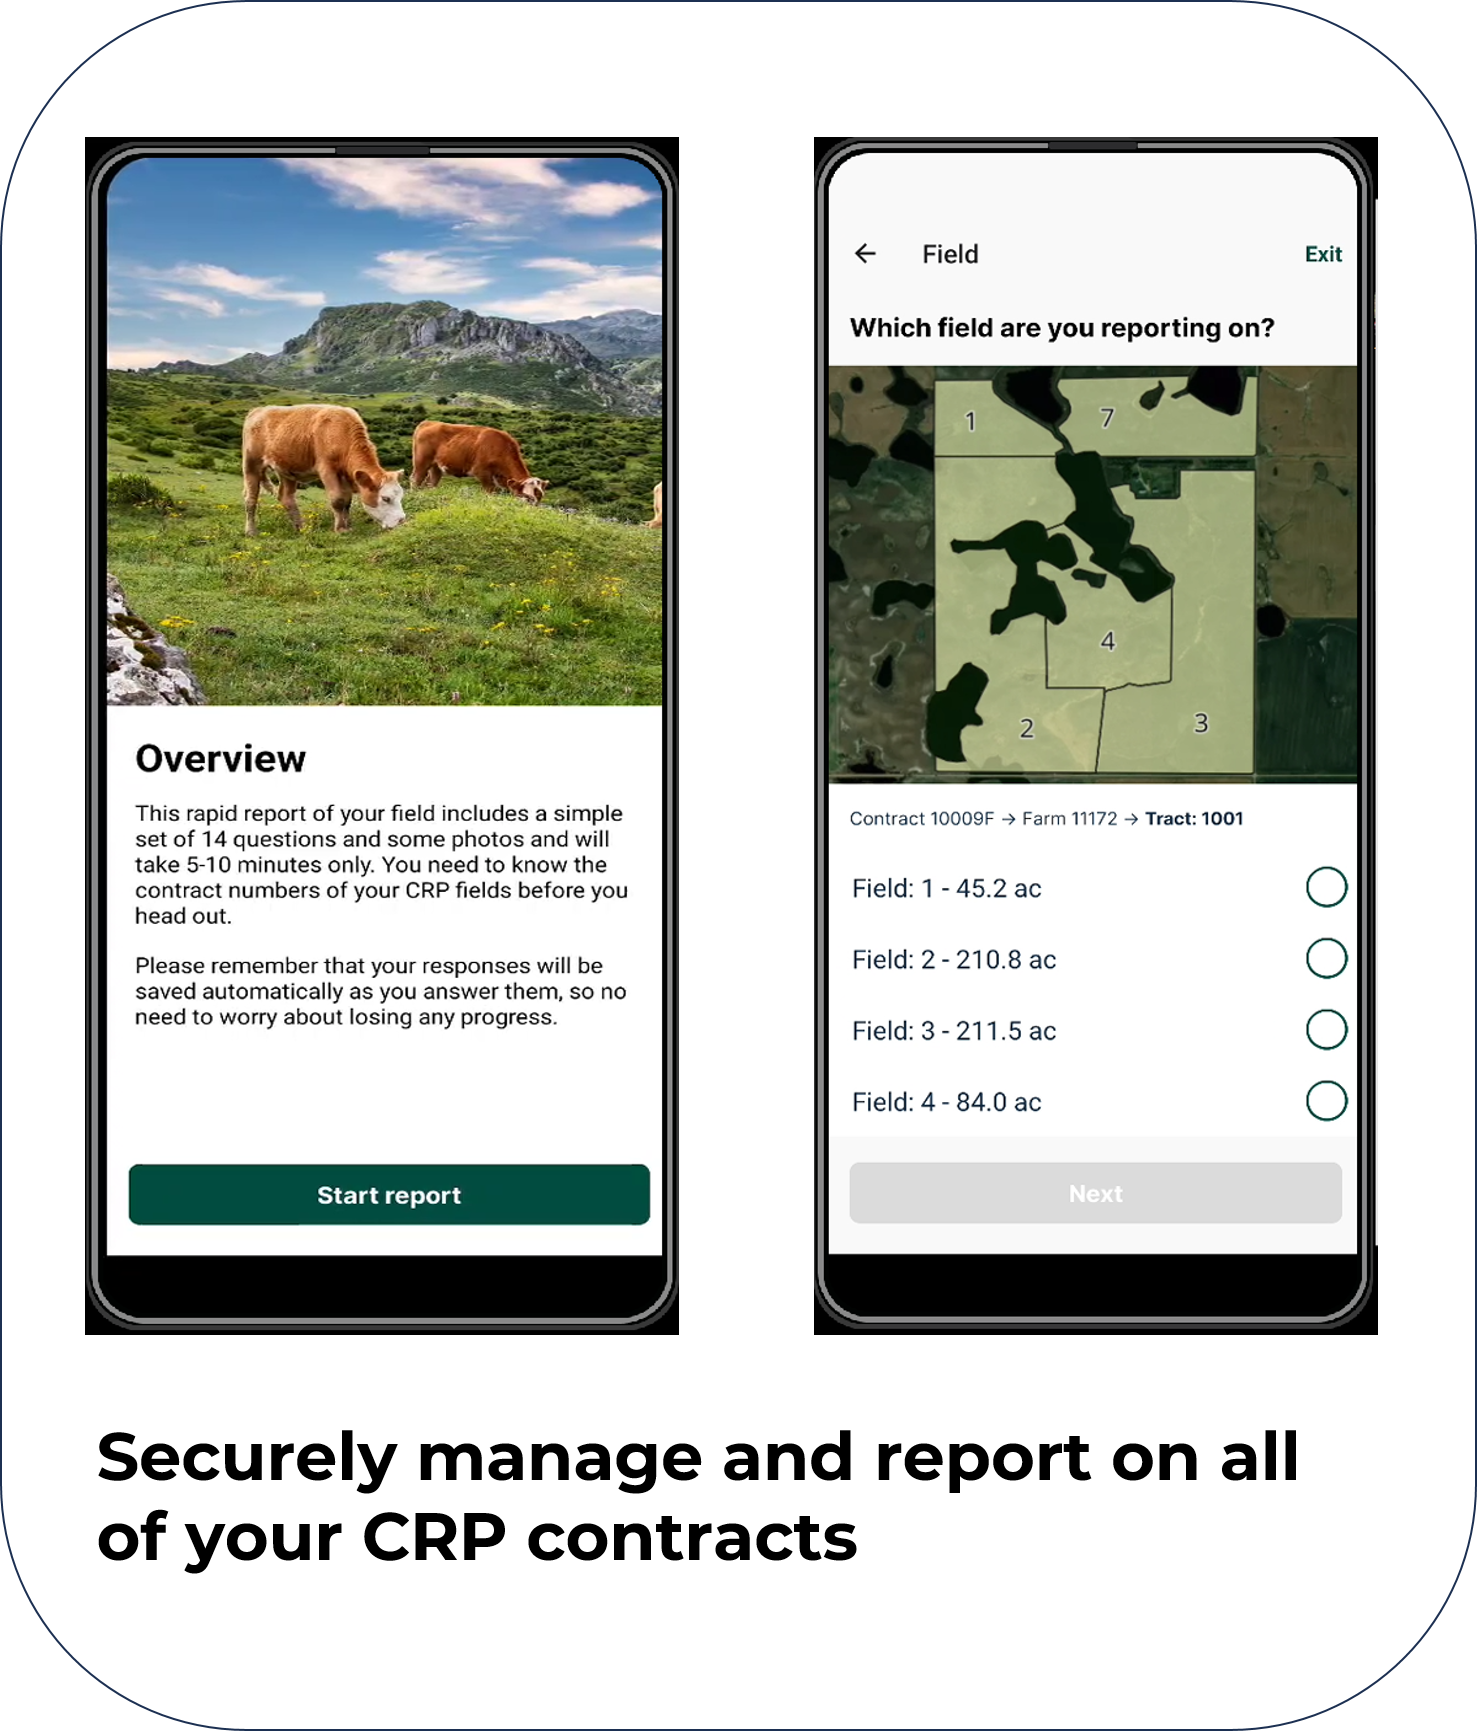
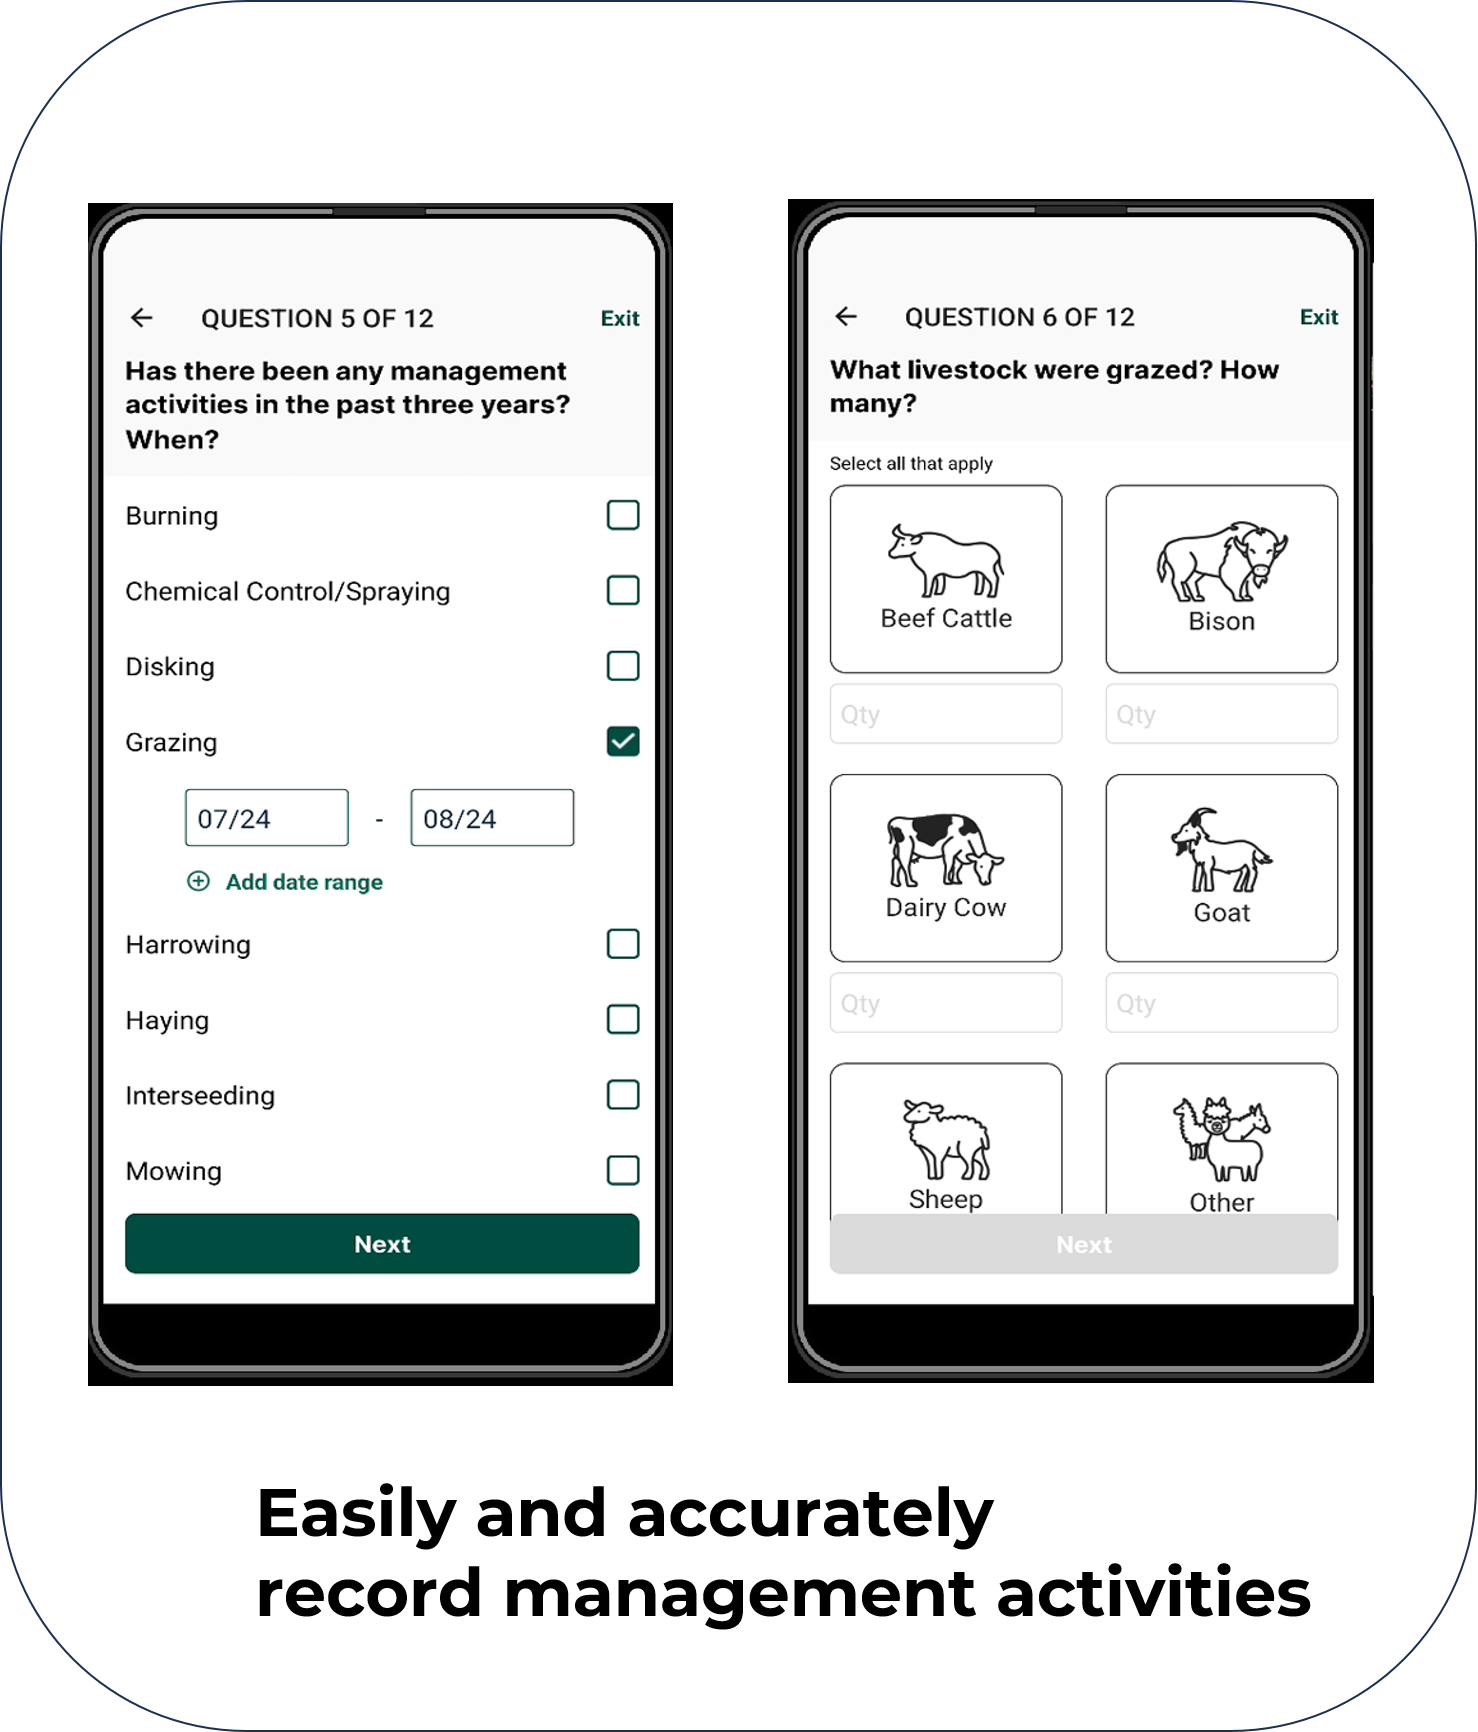
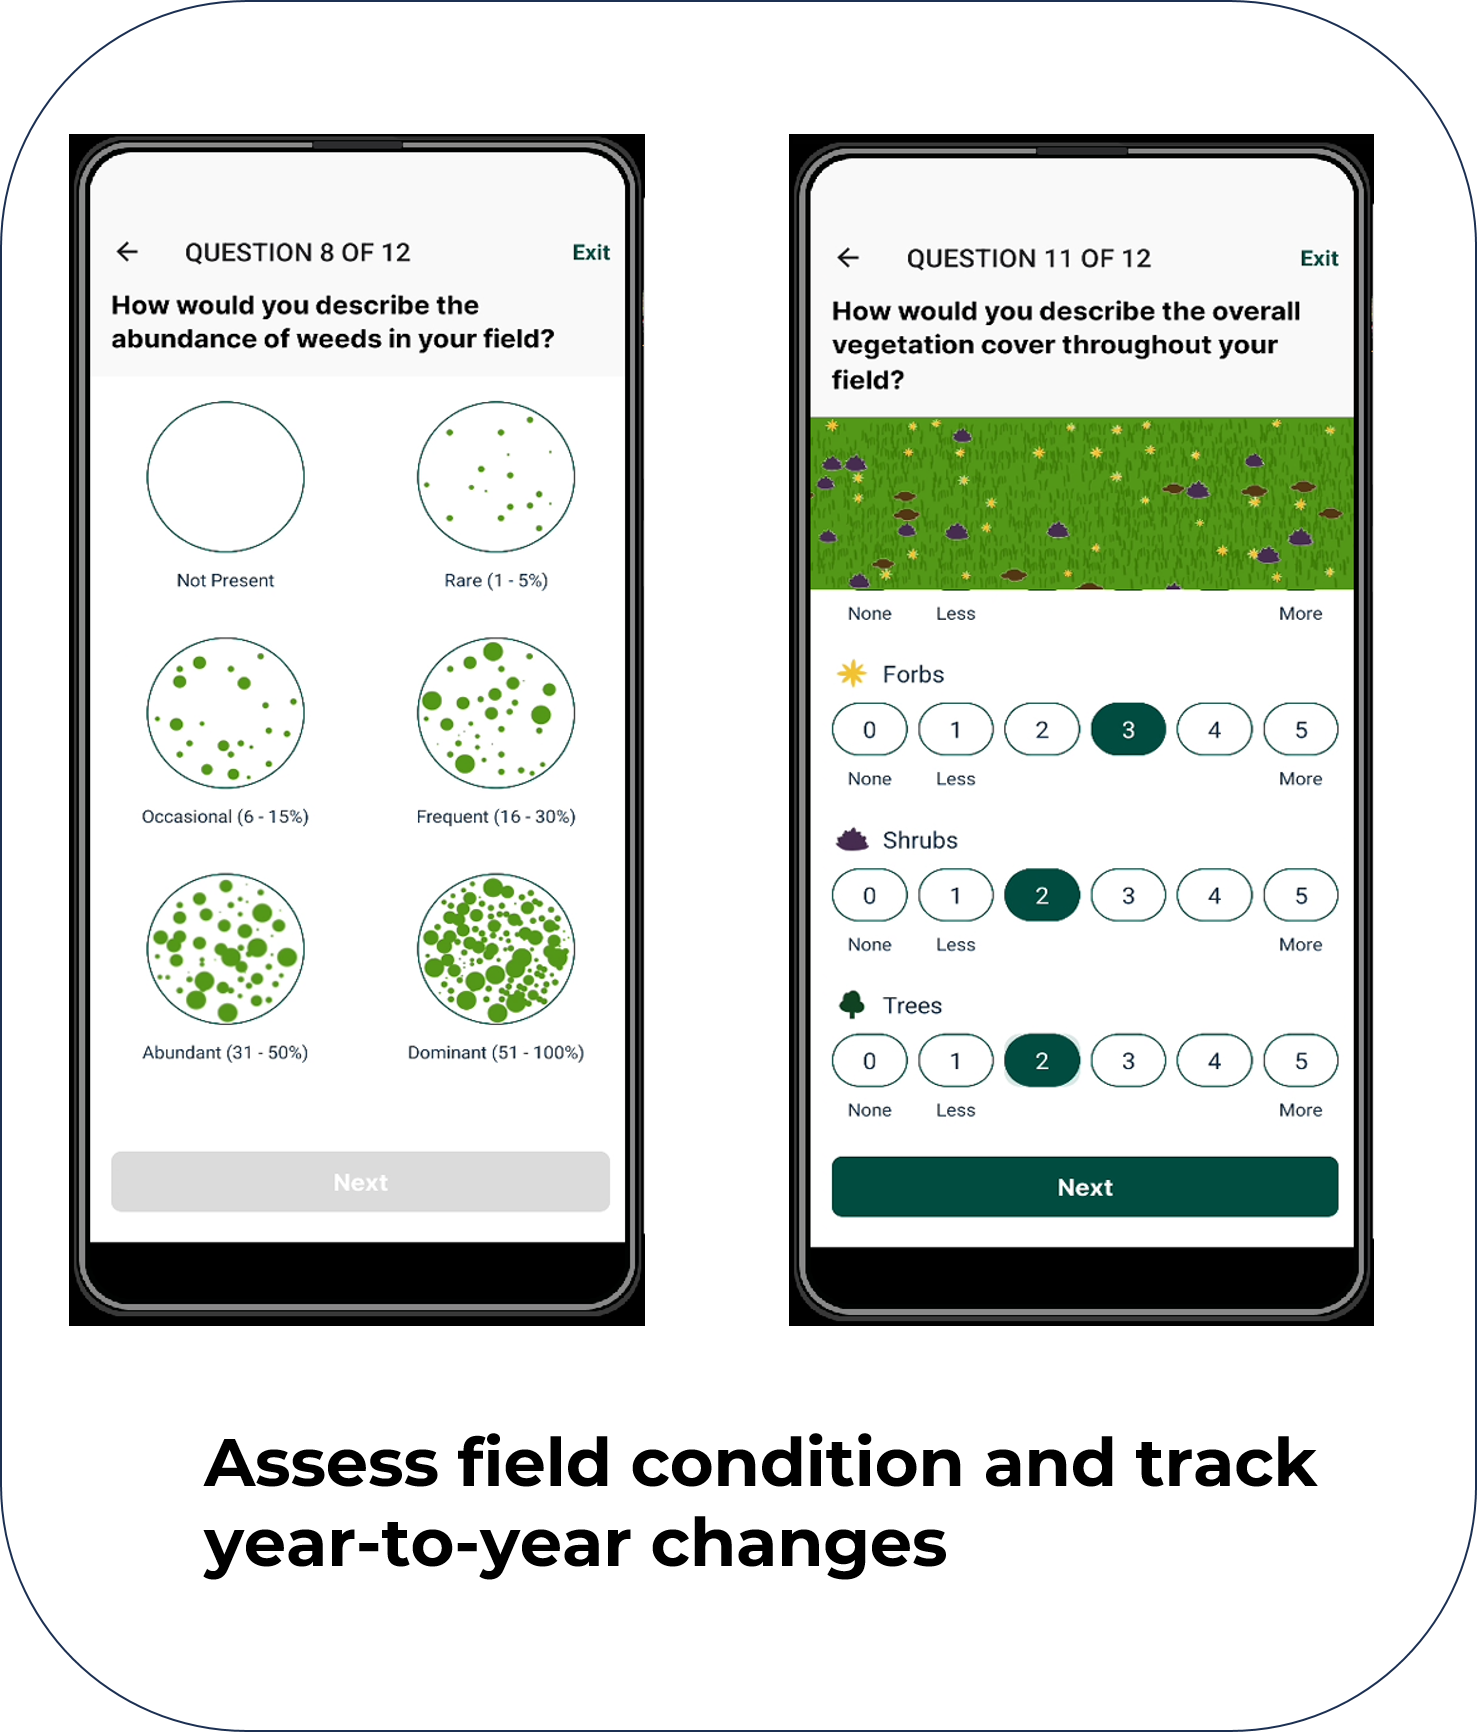
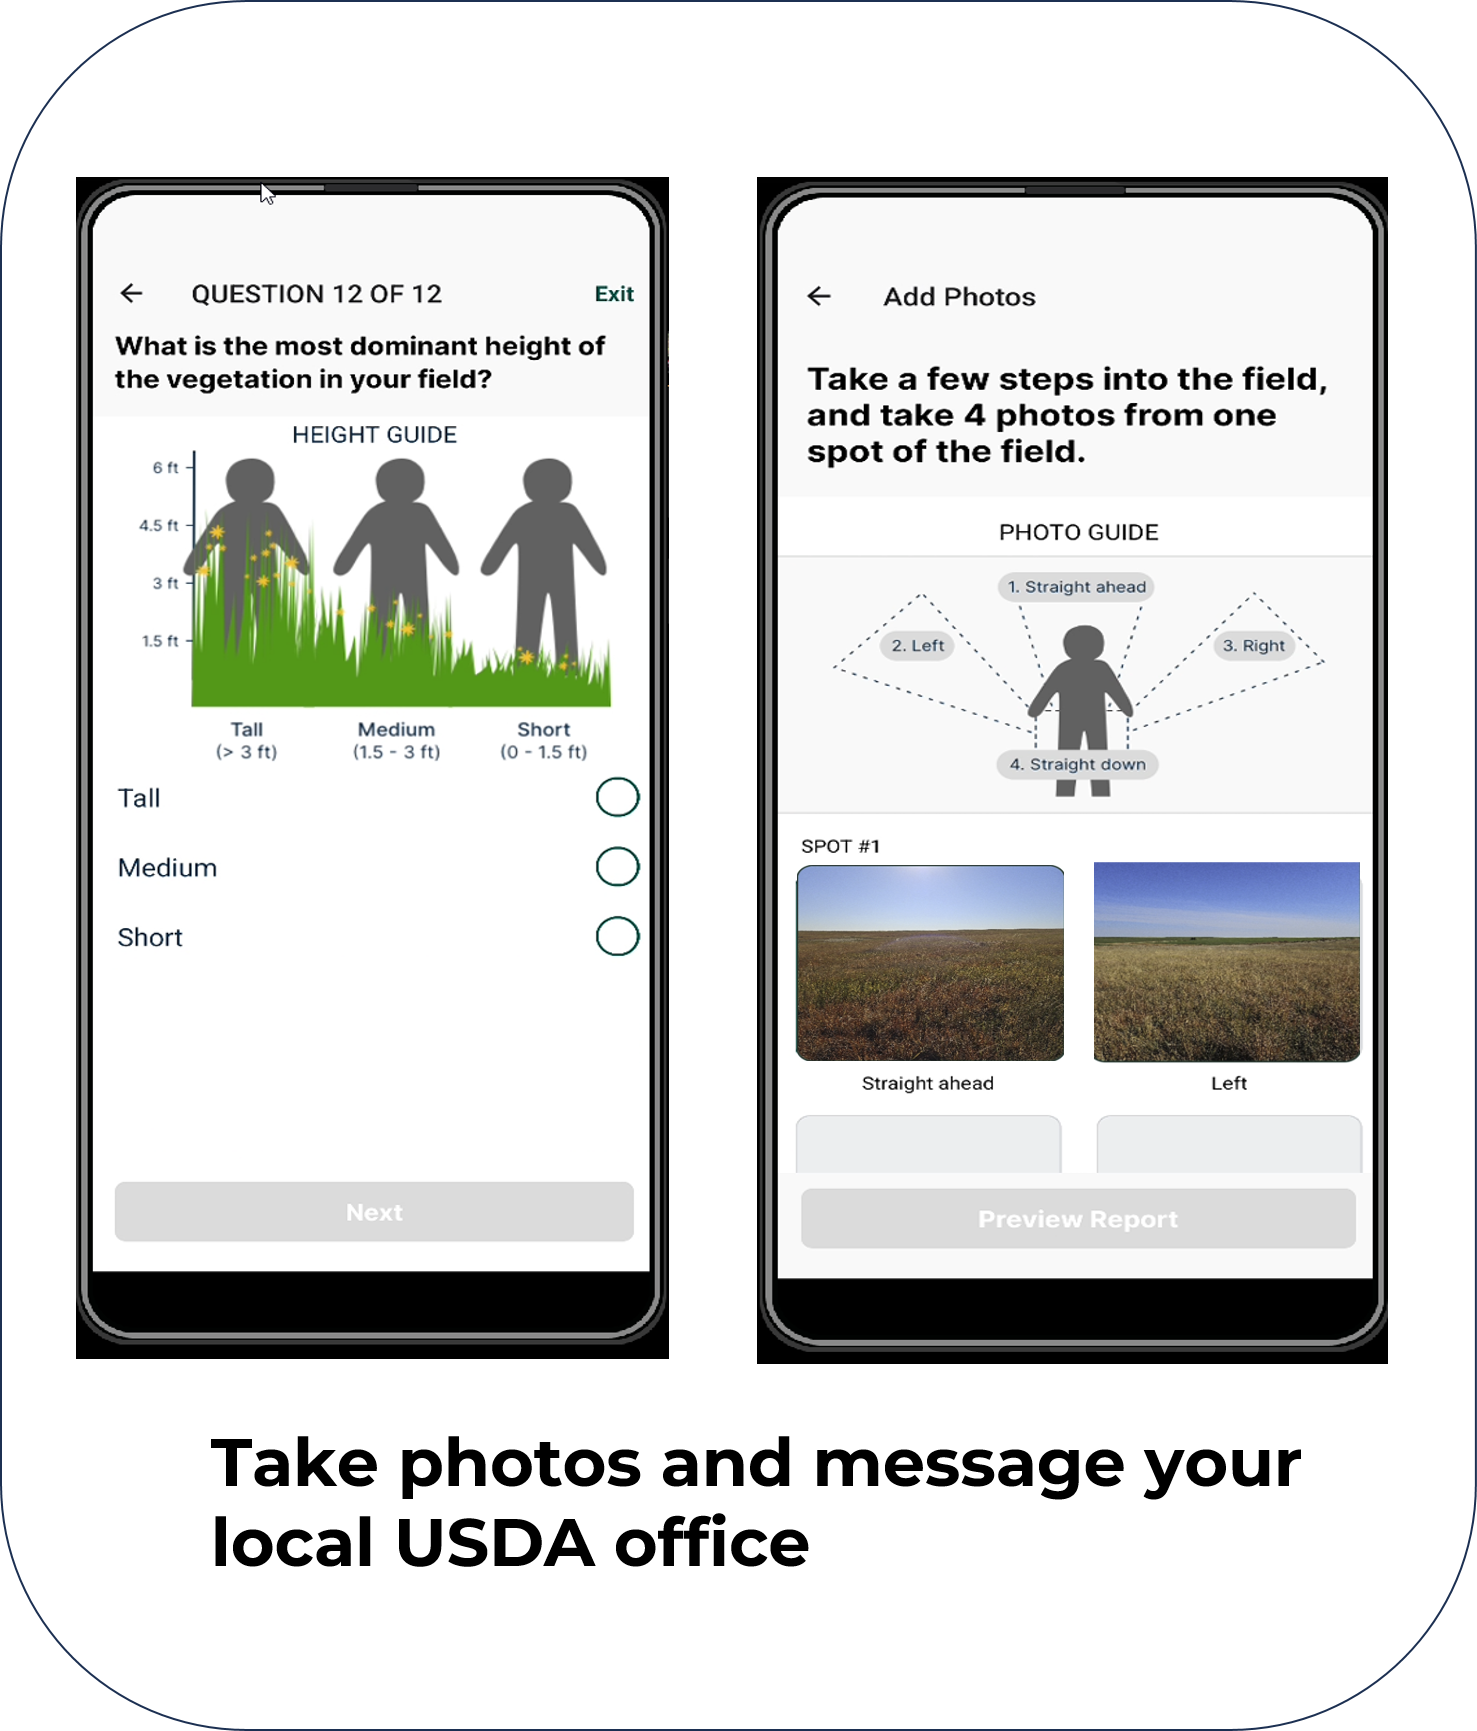

Map-based tools that support the Conservation Reserve Program (CRP) of USDA and other land-based conservation and restoration programs in the U.S
USDA contracted the Conservation Biology Institute (CBI) to design and build a free online easy-to-use Plant and Vendor finder to support the producers associated with the Conservation Reserve Program (CRP). However, the tool is not limited to the CRP program and can serve the needs of any land stewardship effort requiring native seeds/seedlings. In partnership with the Institute for Applied Ecology (IAE) we have added features to address the needs of the Native Seed Network and significantly expanded the native seed customer and vendor base.
The seed and vendor finder can be found here: Plant and Vendor Finder
Currently, CBI has seeded the tool with 214 vendors found through an online search from across the country with limited profiles, and 45 have voluntarily completed full profiles which includes their plant catalogue. The tool is designed for easy uploading of their profile and inventory. It also provides an opportunity for vendors without a website to have an online presence and be found by customers looking for seeds.
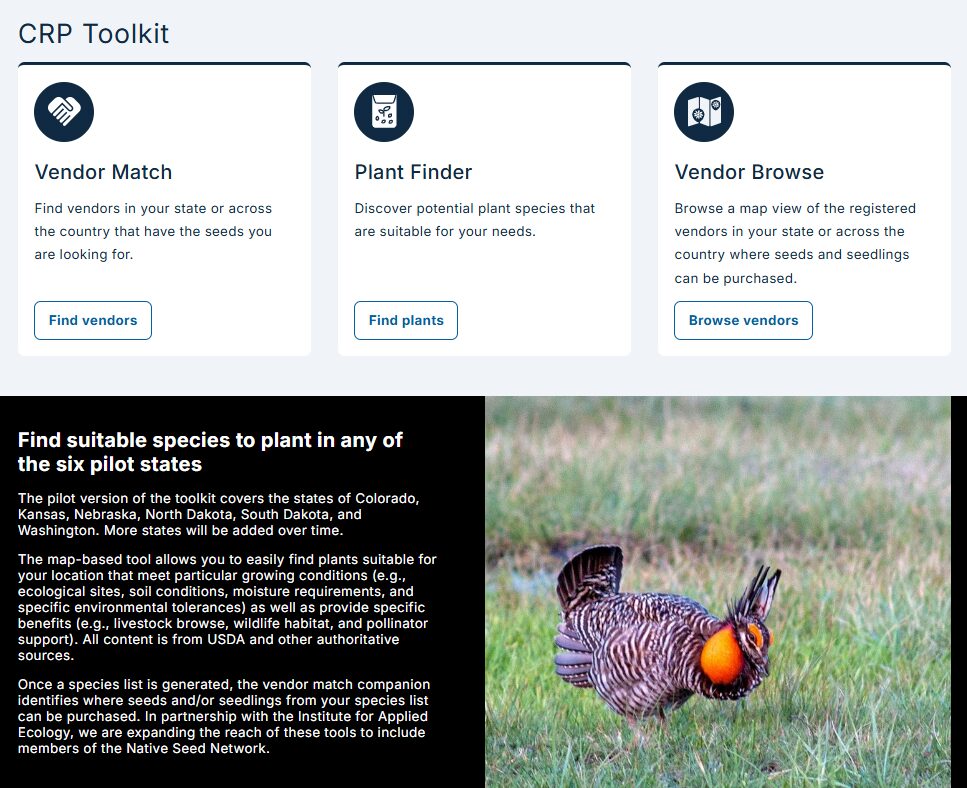
The map-based Plant Finder tool allows you to easily find plants suitable for your location that meet particular growing conditions (e.g., ecological sites, soil conditions, moisture requirements, and specific environmental tolerances) as well as provide specific benefits (e.g., livestock browse, wildlife habitat, and pollinator support). Once a species list is generated, the Vendor Match tool identifies where seeds and/or seedlings from your species list can be purchased. The Vendor Browse tool allows you to easily browse a map view of the registered vendors in your state or across the country where seeds and seedlings can be purchased.
All data content is from authoritative sources, including NRCS state resources, NRCS Ecological Site program, and the USDA PLANTS database.
The vendor match and browse tools have been updated in partnership with the Institute for Applied Ecology (IAE)for the Native Seed Network. Note that IAE uses its legacy name `Seed Finder tool’ for what is essentially the same as the USDA Plant and Vendor finder tool.
Tutorial Videos
The USDA Conservation Reserve Program (CRP) works with private landowners to advance conservation on their lands. This voluntary program currently comprises over 23 million acres making it an extremely important component of conservation in America, particularly in locations with limited public conservation lands. Management actions taken on enrolled lands include augmenting native vegetation for pollinators, providing habitat for grassland plants and animals, increasing biodiversity, reducing soil erosion, and improving water quality.
CBI is working with USDA to improve the effectiveness and efficiency of the program as it strives to expand enrollment in the coming years. Working in several pilot states (Mississippi, Kansas, Colorado, Washington, Nebraska, and the Dakotas), CBI is focusing on the following tasks:
- Create an online service open to the public that assists landowners to identify plant mixes most appropriate for their locations and management goals and vendors where seeds/seedlings can be acquired.
- For agency and CRP contract holders, create an online service that helps manage emergency haying/grazing requests.
- Develop and implement technology and protocols (e.g., phone field assessment app) that will involve contract holders more in the implementation of their agreements, which will provide important monitoring for improved program evaluation.
- Improve mapping and monitoring of forests and grasslands as they relate to CRP goals and objectives using the latest remote sensing technology, machine learning, and high-end processing resources.
- Conduct spatial analyses to help the program prioritize areas for more targeted enrollment.
- For agency users, provide an online service that allows for rapid and meaningful assessments of conservation management outcomes on CRP lands.
CBI Takes a Field Trip!
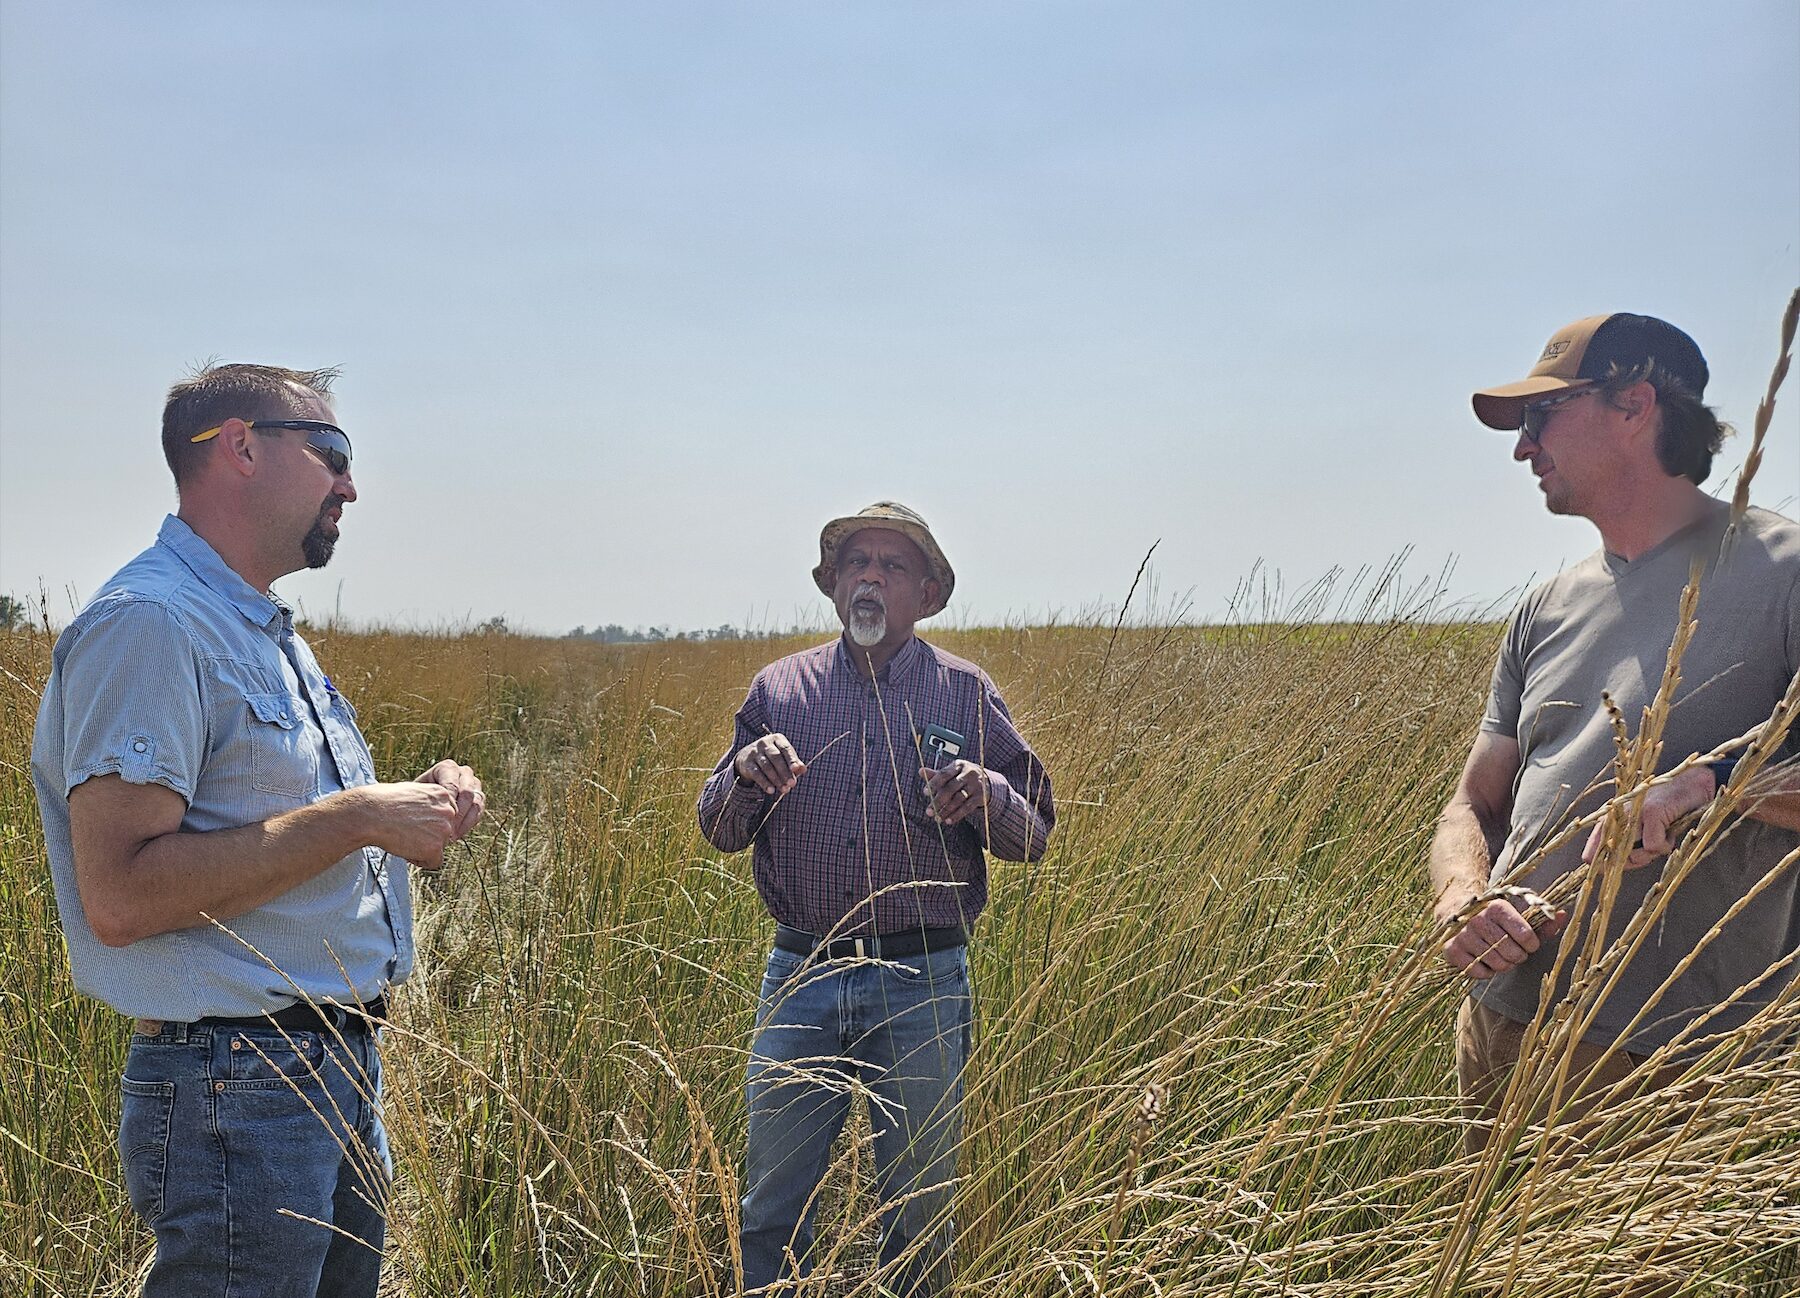
CBI headed to Jamestown, North Dakota, to speak with producers and USDA county staff regarding the USDA Mobile App, a tool designed for self-reporting, assessment, and communication surrounding CRP fields. We tested the app on over 35 fields to incorporate feedback from on-the-ground users, train remote sensing data, and test the effectiveness and ease-of-use of the tool. We coordinated with USGS, as well, testing this app on several of their pollinator plots, in conjunction with another CBI project.
Additionally, CBI traveled to Bismark and spoke with state NRCS staff, in order to hone and edit management questions and expand the usefulness of the app for reporting requirements and data gathering. Our experience was invaluable, as truthful reactions and deliberate responses from those who will eventually be using the tool, are critical in creating something that will be utilized and, ultimately, successful.
The Conservation Biology Institute’s Environmental Evaluation Modeling System (EEMS) is a fuzzy-logic modeling framework that can be applied to a wide range of conservation and planning applications. With EEMS, data of different types and formats from multiple sources can be combined to answer questions such as current and future habitat value, ecological/development conflict, and landscape vulnerability to climate change.
To use EEMS, a user builds a tree-based logic model in which the bottom nodes represent the initial data inputs. These data values are converted into fuzzy values (based on the premise that each input value can be represented by a value ranging from -1 for fully false to +1 for fully true). Fuzzy logic operations (analogous to basic logic operations such as AND and OR) are then used to combine nodes hierarchically until a final value representing the answer to a research question, (e.g., what is the relative value of endangered species habitat across our study area?), is produced.
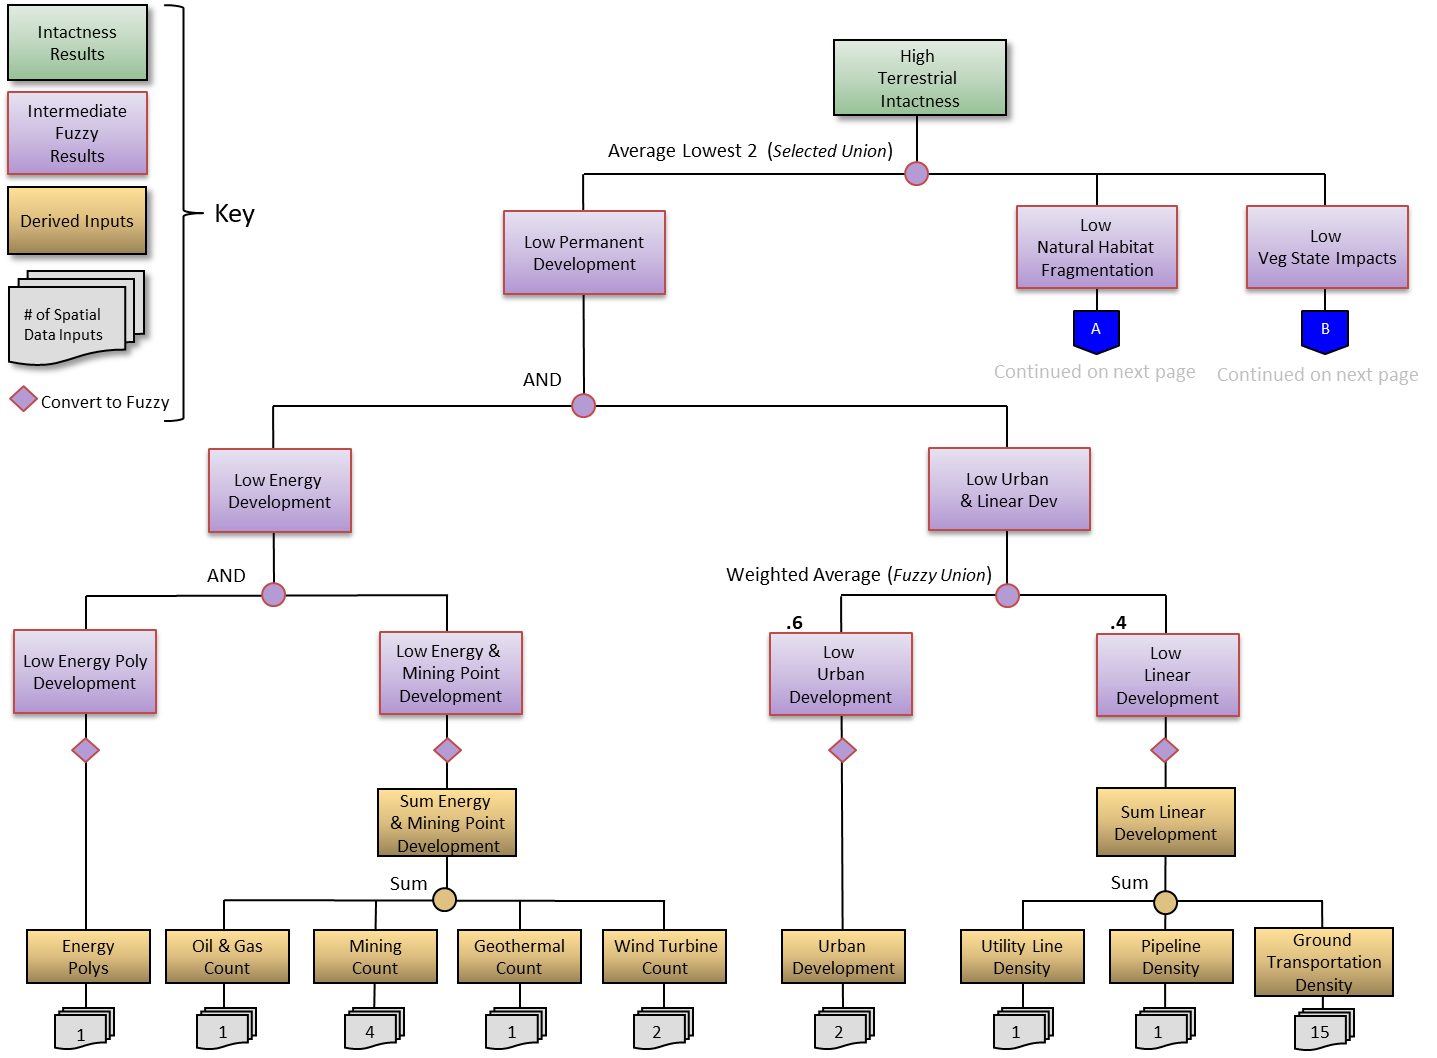
There are many advantages to this data-driven modeling approach: (1) it’s highly interactive and flexible; (2) it’s easy to visualize data sources and analysis structure; (3) components are modular, making it easy to add or exclude information; (4) model parameters can be adjusted using a number of different mechanisms; and (5) numerous data of different types can be included into a single integrated analysis.
EEMS modeling has been applied by CBI scientists in a wide range of planning and ecological applications. In the Tehachapis and Southern Sierra, a model incorporating data for habitat presence, habitat linkage, and disturbance was used to find areas of high ecological value and to provide guidance for reserve design to inform siting renewable energy infrastructure. For the Bureau of Land Management Rapid Ecological Assessments of the Sonoran Desert and Colorado Plateau ecoregions, EEMS models were developed and used to evaluate a variety of current and projected ecological metrics such as landscape and aquatic intactness. This approach has also been used to support the State of California’s offshore wind renewable energy planning process via the development of EEMS models to help assess a range of important considerations such as wind energy potential, deployment feasibility, ocean uses, fisheries, and marine life occurrence.
EEMS Visualization and Exploration Tools
EEMS Explorer is a tool integrated into CBI’s Data Basin platform that allows users to examine EEMS models in a dynamic web-mapping environment. It provides an interactive model diagram coupled with a map display that allows users to “drill down” on an EEMS model to examine its structure, data, and logical relationships. This gives scientists and land managers the ability to determine what landscape metrics are driving model results at any given location.
EEMS Online provides another avenue for users to visualize and interact with EEMS models in a web environment. In addition to providing a rich and powerful set of tools for examining a model’s structure, data, and logical relationships, it helps facilitate the EEMS model development process by allowing users to modify a model’s parameters (e.g., weights, thresholds, and operators) to see how these changes affect the results. The modified model can then be shared among project team members, collaborators, and stakeholders for evaluation and feedback.
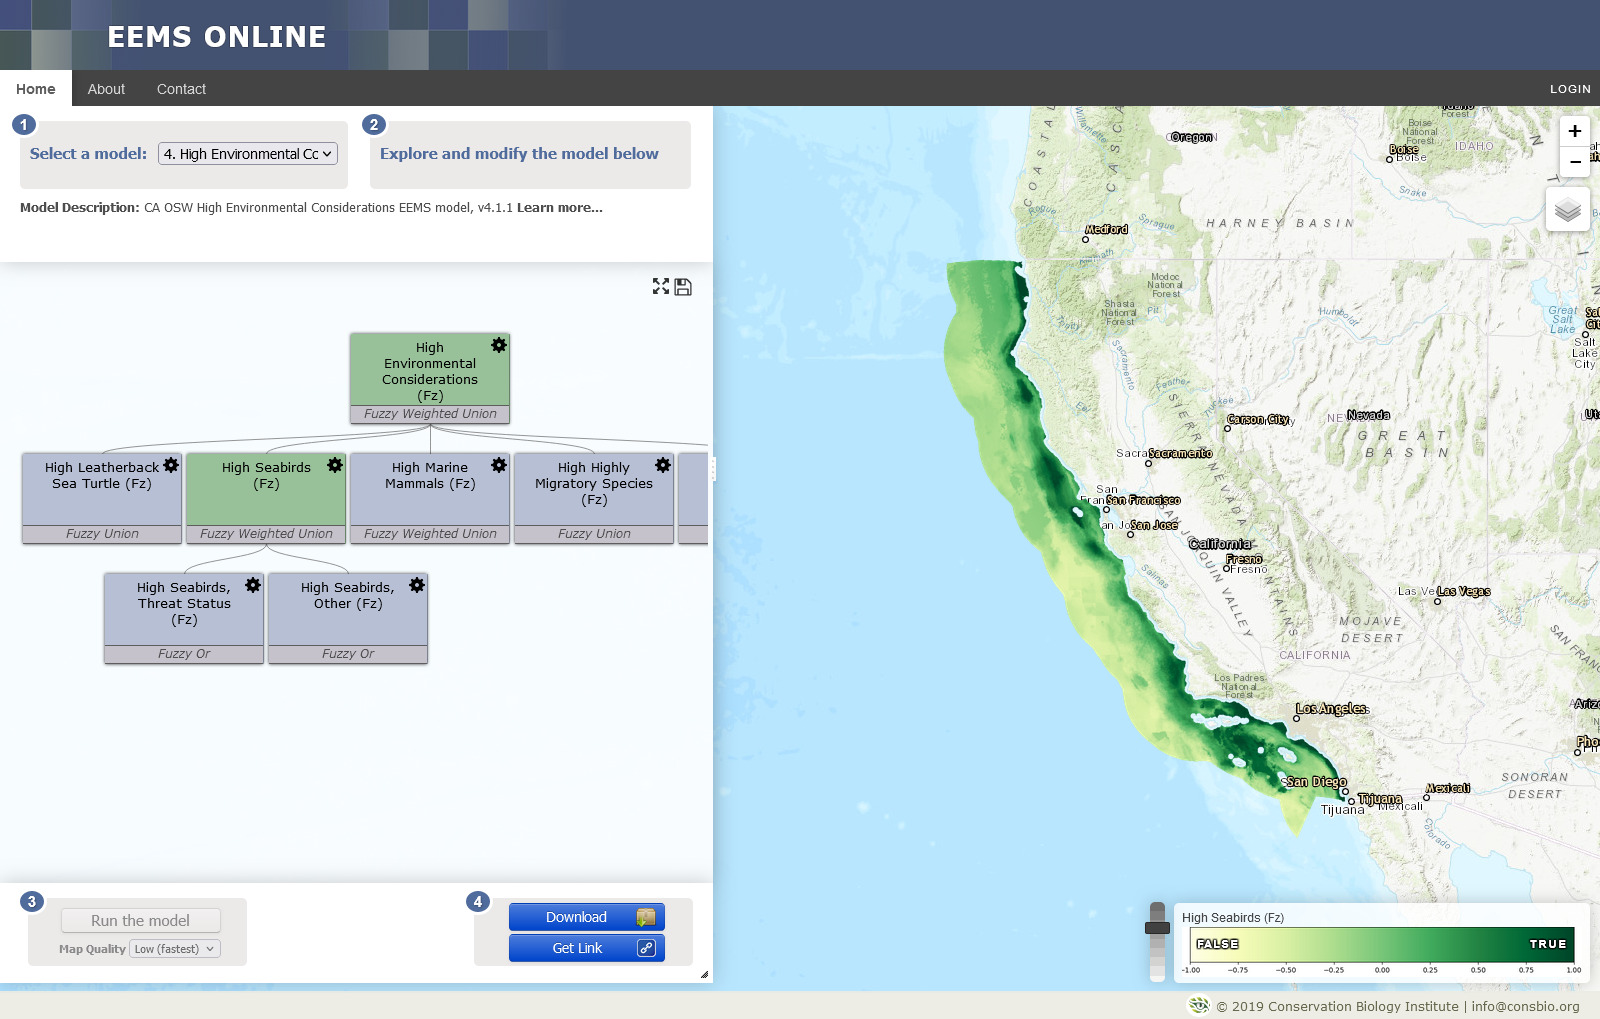
The combination of EEMS, EEMS Explorer, and EEMS Online provides a powerful system for the development, dissemination, and evaluation of complex models in a way that is both transparent and accessible. By helping to bridge the gap between science and technology, CBI’s EEMS modeling platform has become an important tool in helping to guide and inform conservation management and planning decisions.
Getting Started
EEMS is written in Python and maintained as a collection of libraries within MPilot– a plugin-based, environmental modeling framework developed by CBI.
EEMS Pro is an ArcGIS implementation of EEMS that interfaces with these libraries and allows users to construct models visually using ESRI’s ModelBuilder environment.
Models can be developed using either platform, however EEMS Pro is recommended for those with experience with ArcGIS and Model Builder.
EEMS Pro is compatible with both ArcGIS Desktop (>=10.6) and ArcGIS Pro. To get started with EEMS Pro, download the latest version here, which includes the EEMS Pro toolbox, a manual with installation instructions, and a set of tutorial data.
Learn More
See “Related Resources” on the upper right of this page.
For an introduction to EEMS in ArcGIS, an explanation of the fuzzy logic concepts EEMS uses, and a demonstration of the EEMS Model Explorer, please click here to view a recorded webinar.
To view a recorded webinar titled “Decision-support for regional reserve design and siting of renewable energy and infrastructure”, please click here.
The Wildfire Resilience Planner: Strategic Planning at the Landscape Scale
Sonoma Water, Conservation Biology Institute (CBI), Ag Innovations, Pepperwood Preserve, Tukman Geospatial, Digital Mapping Solutions have created the Sonoma County Wildfire Resilience Planner, an online decision support tool for prioritizing locations to reduce wildfire fuels to protect lives and property, community infrastructure, ecosystem services, and biodiversity. The tool encourages collaborative planning of projects on public and private land, helping to leverage individual efforts for a unified and strategic approach to fuels management. The Wildfire Resilience Planner is available for use at https://sonoma.resilienceplanner.org/. For more information or to provide feedback, please contact Molly Oshun, Molly.Oshun@scwa.ca.gov or Deanne DiPietro, deanne.dipietro@consbio.org.
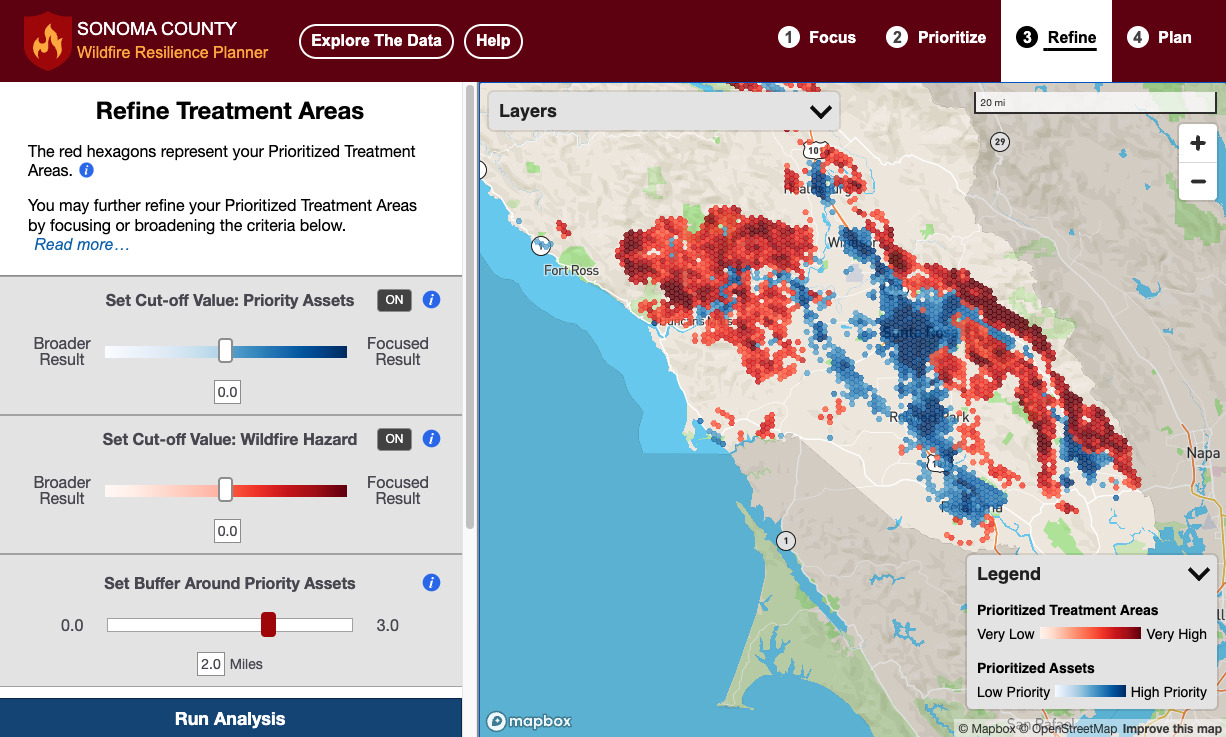
Above: the Sonoma County Wildfire Resilience Planner provides the user with the spatial data and analysis tools to identify high-priority locations for wildland fuels management.

West Coast Estuaries Explorer, a tool designed to engage a broad range of users with detailed information about estuaries along the U.S. West Coast. CBI developed this tool in partnership with the Pacific Marine & Estuarine Fish Habitat Partnership (PMEP). The partnership is supported by NOAA and the Pacific States Marine Fisheries Commission (PSMFC). The Explorer includes aerial images for each of the estuaries in Washington, Oregon, and California.
These highly dynamic systems, where rivers meet the ocean, provide many important ecosystem services. They provide essential habitat for a wide range of species, including fish, shellfish, shrimp, and crabs. Estuaries have also been significantly altered and degraded by human activities. Many along the West Coast are in poor condition or have lost significant habitat.
This viewer allows you explore estuaries along the coastline of Washington, Oregon, and California. Learn more about estuaries and their role in providing habitat for key species. Get involved to help restore these important ecosystems.
Species Potential Habitat Tool (SPHT) allows managers to identify suitable species for specific sites under current climates and a range of future climate change scenarios. The tool allows forest managers to select species to plant or to promote using other silvicultural activities such as natural regeneration or thinning. Thus, the SPHT can help promote the transition of forest to species compositions that are better adapted to future climates. The SPHT may be used in conjunction with the Seedlot Selection Tool (SST) to allow users to explore options for both species-level and within-species assisted migration. Currently the tool has data for five key species (e.g., Douglas-fir, lodgepole pine, ponderosa pine, Sitka spruce, and Engelmann spruce) in western North America, and this will eventually be expanded to 42 tree species.
Environmental Risk Screening Tool will help guide Chinese international investment projects. The overarching goal of the tool is to significantly reduce negative environmental impacts resulting from Chinese development projects around the world. The screening tool includes interactive mapping of biodiversity and environmental data against which potential development projects can be evaluated. The tool includes a standard Biodiversity Impact Analysis using a set of internationally recognized datasets (e.g., Key Biodiversity Areas, Critical Natural Habitat, Alliance for Zero Extinction sites, and Protected Areas). The tool will also include regional and country-level biodiversity and environmental data in priority countries. It is scalable for any region in the world. The tool is not available for viewing at present. But here is a powerpoint describing its capabilities.
