Urgent Effort to Preserve Environmental & Climate Data

According to a New York Times analysis published on February 2, 2025, “more than 8,000 web pages across more than a dozen U.S. government websites have been taken down … as federal agencies rush to heed President Trump’s orders.” Already, reports of missing data related to “climate”, “resilience” and “environment” have started flooding in. Conservation Biology Institute‘s Data Basin platform is well suited to host this type of spatially explicit data and is free to use.
In 2016, there was a similar purge of environmental data from Federal government websites, and at that time, CBI was able to preserve some of that data. During that period climate change datasets were the most targeted. Climate change data is once again being targeted as it is evidence of what All Gore called “inconvenient truths”. However, the purge target is much larger this time and many important datasets are in potential jeopardy. Anything that would “interfere” with oil and gas development, logging, and rolling back current environmental laws and accountability are threatened. The list is too long to provide.
CBI has launched an effort to preserve as much important environmental data as we are able, and you can help us in that effort.
If you have a background in GIS and would be willing to volunteer your time toward collecting and uploading data to the Data Basin platform to aid in the effort of preserving important climate and ecological data, please fill out this form, and we will be in touch about ways you can contribute to the effort.
If you’re unable to participate in this effort, but want to support it in other ways, a donation would be greatly appreciated at this time, as our hosting costs will inevitably go up as we add additional data to the platform.
New Video Tutorials
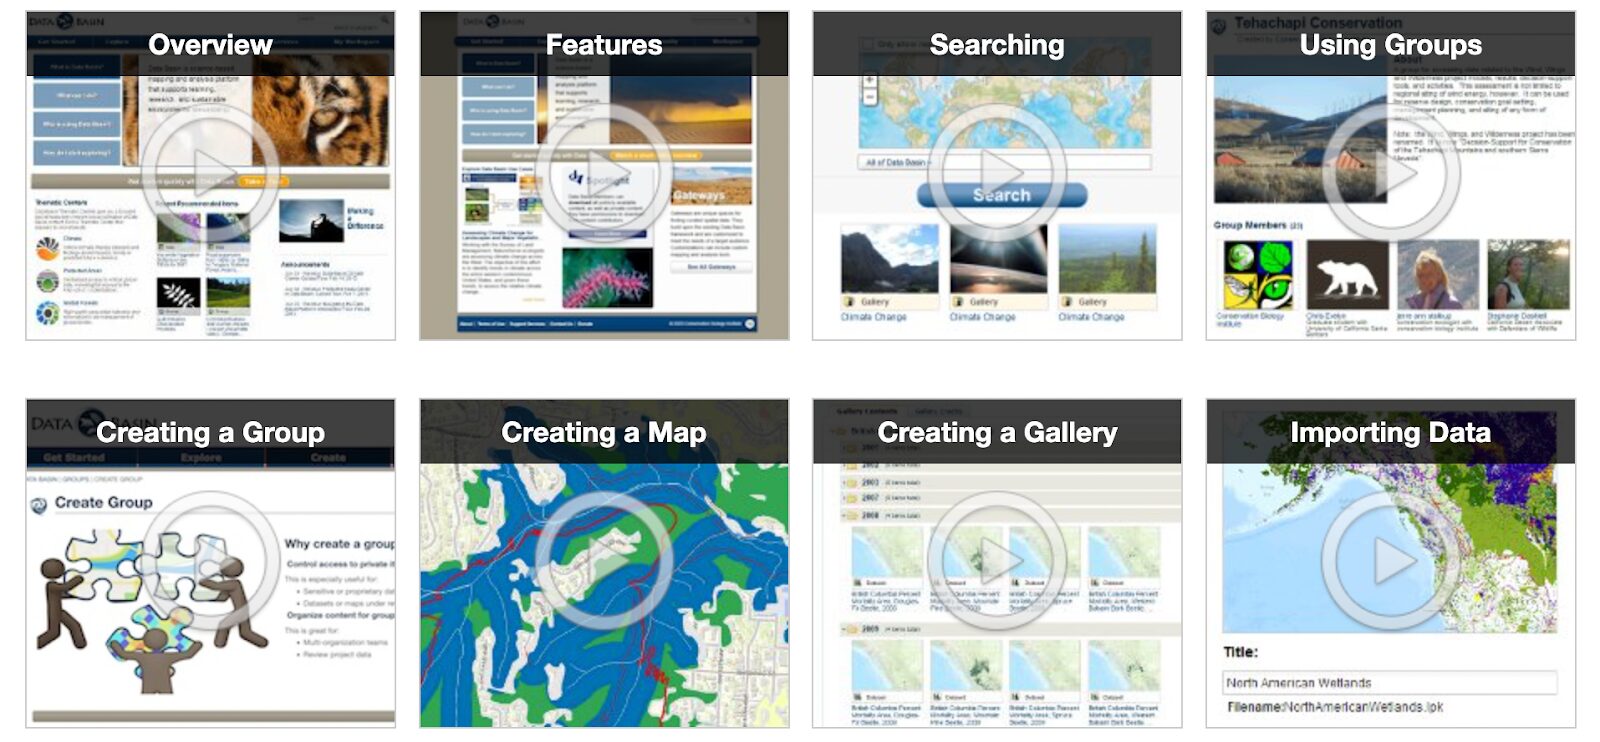
New and experienced Data Basin users alike may find our new library of tutorial videos useful. We cover everything from data imports, to map creation, to use of groups. There is likely some useful tip or trick for each of you in these videos, and we encourage you to take a look.
Supporting Offshore Renewable Energy Development
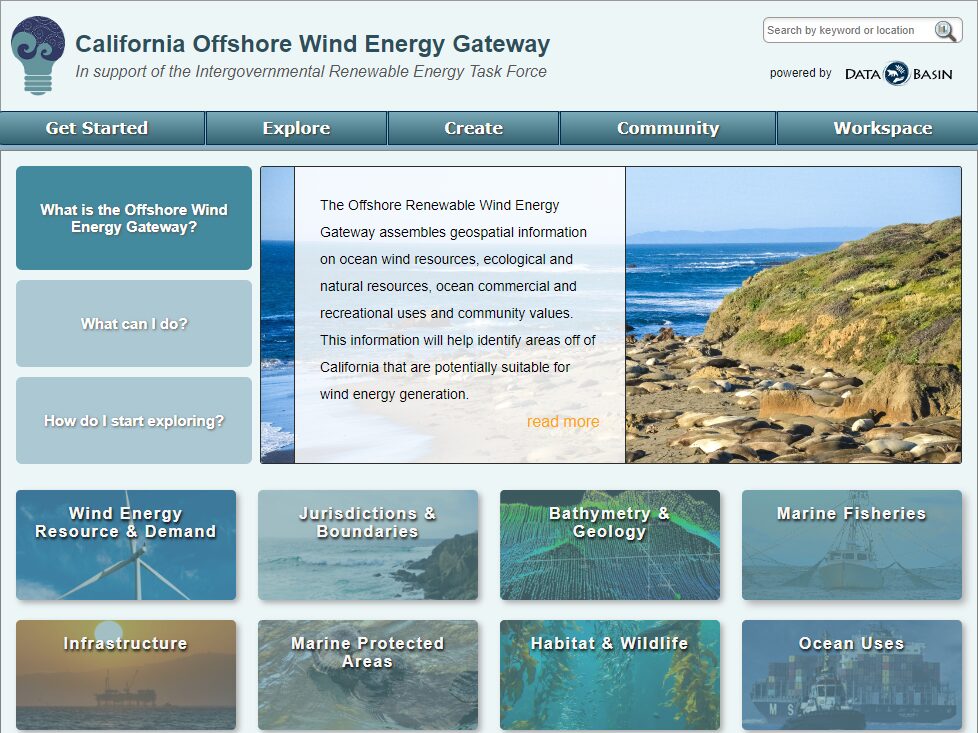
Data Basin has supported the public process for exploring the social and environmental feasibility of offshore wind development off the California coast since 2019. Data Basin has provided the ability for all interested parties to review available relevant spatial data in an easy-to-use fashion, which continues to be routinely updated and curated. With a number of lease sales recently completed, Data Basin is beginning to move into supporting the next phase of the process. Data Basin has proven to be a valuable resource in support of this very complex planning and implementation process.
As work continues off the coast of California, new renewable energy gateways are being planned and scheduled. Over the coming months, we hope to have two additional gateways underway focusing on offshore energy development. One will focus on offshore areas around the Island of Guam and the other will focus on Cook Inlet, Alaska.
Click here to explore the California Offshore Wind Energy Gateway!
New Use Case: Protecting Prime Farmland in the San Joaquin Valley, California
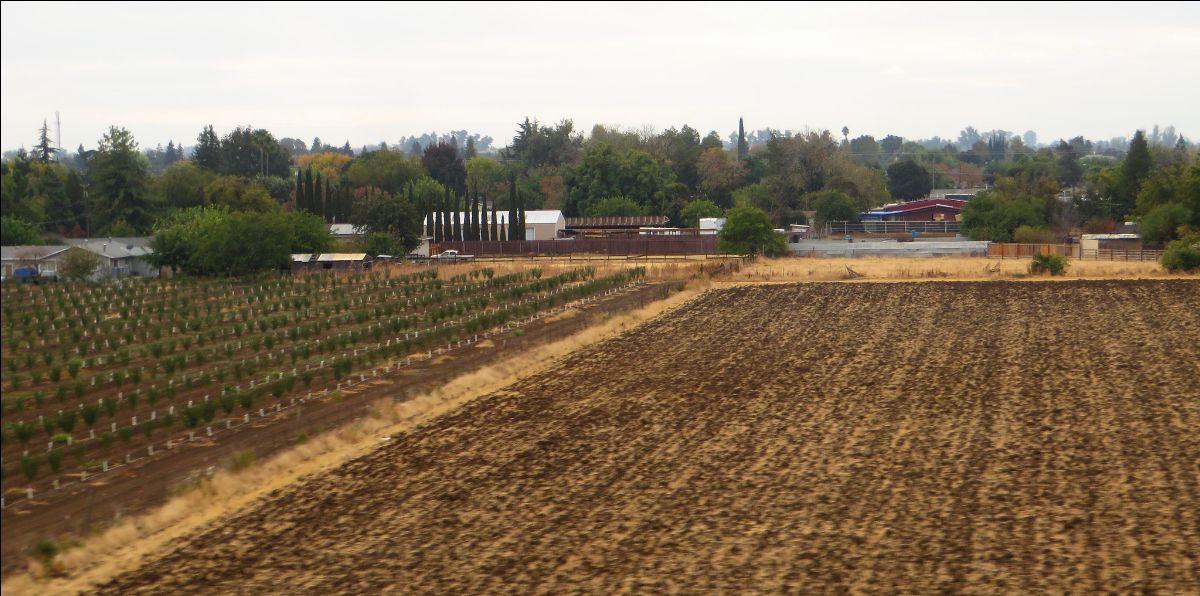
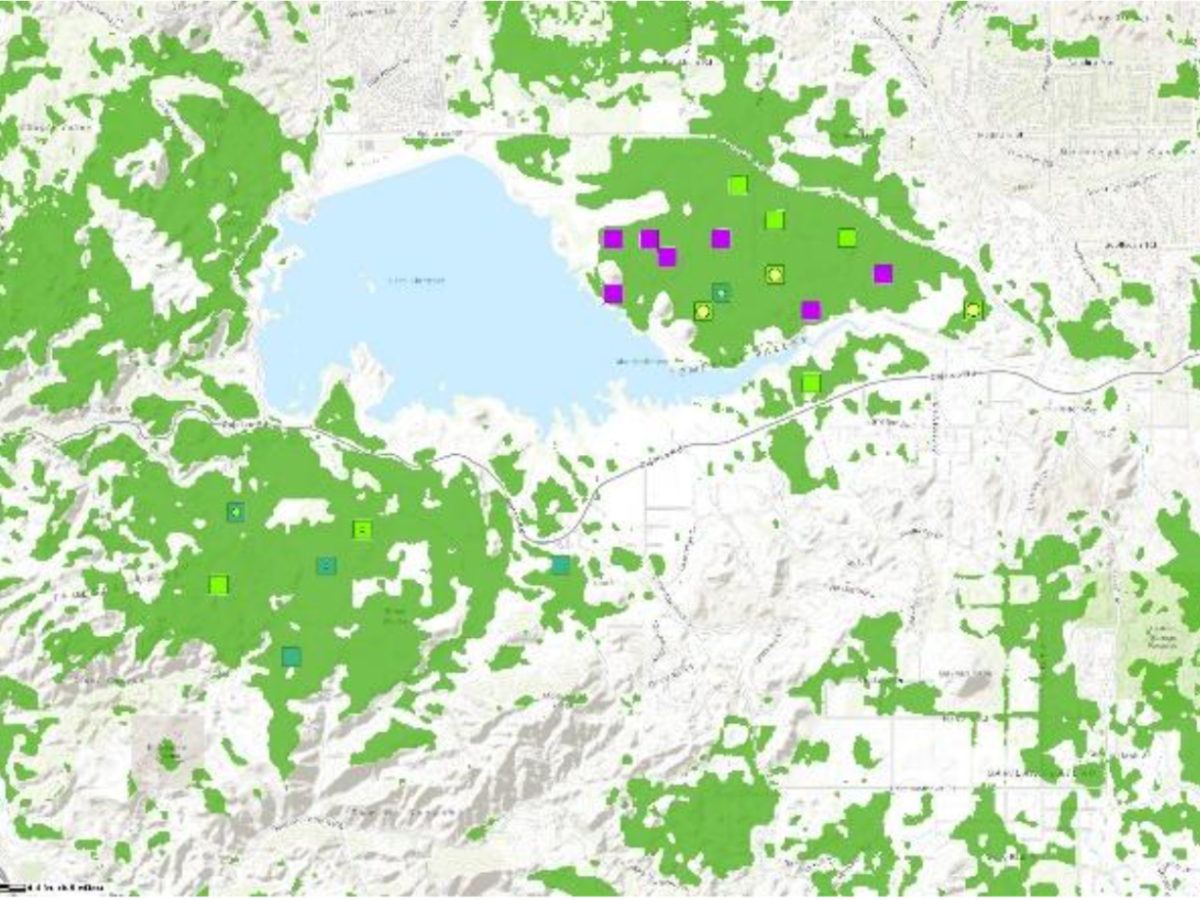
The San Joaquin Valley Project Prioritization Tool (PPT) constructed using Data Basin was designed to identify valuable farmland in the San Joaquin Valley so it could be protected from ongoing development in this extremely valuable agricultural area in the state and the country. This simple decision-support tool (in this case a customized map) was used to protect a long-time family-owned farm located in Merced County. Protecting this ranch with a conservation easement means that 1,100 acres of farmland in a rapidly developing region will be preserved. Video overview of Lost Wagon Wheel Ranch. American Farmland Trust article on Lost Wagon Wheel Ranch. One of the primary considerations of this easement establishment was to protect a valuable water recharge area thereby improving groundwater levels in this highly stressed region of California.
To read more about this Use Case in Data Basin, click here!
Tool Tip: Saving a Map from an Existing Map
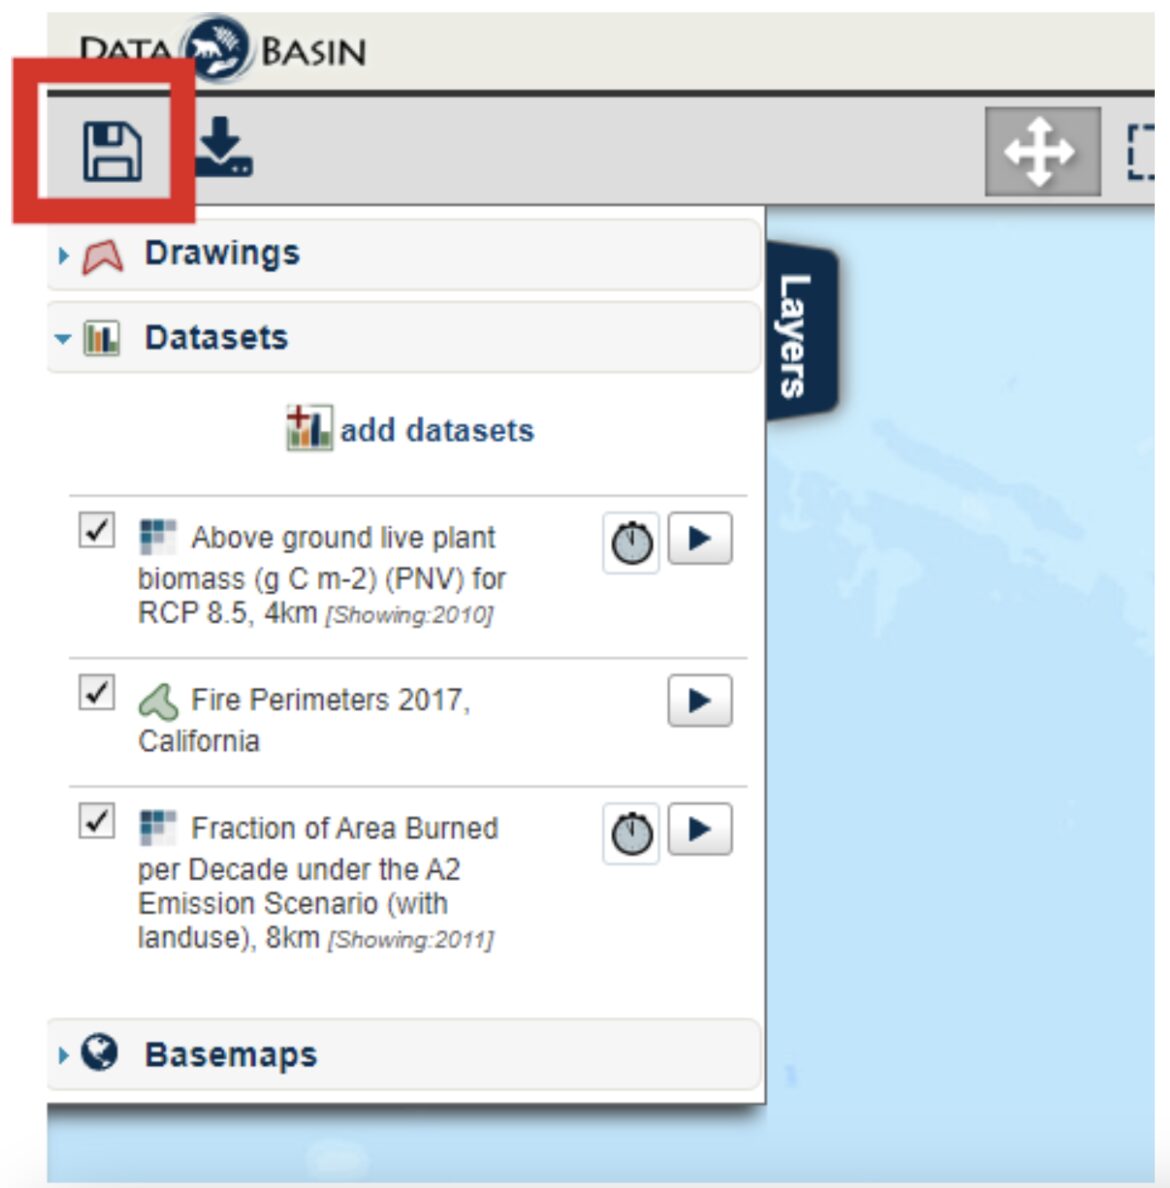
There may be times when you come across a map in Data Basin that was created by another member that contains a lot of the datasets of interest. Under these circumstances, you can save a lot of time building off of someone else’s map rather than constructing your own from scratch.
To get started, you must be logged in first. Open the public or shared private map of interest. The example we use here comes from the Use Case described above. Open the map called San Joaquin Valley Project Prioritization Tool. You will find many relevant datasets with the Prime Farmland shown in light green by default. You can now style the map the way you want such as making different layers visible, adjusting colors and transparency, removing some datasets from the map, and/or adding others. Once you have what you want, click on the disk icon in the upper left corner of the map page.
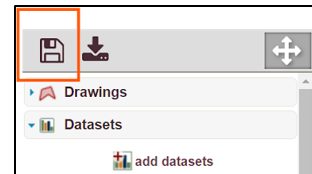
Don’t worry, the system will not allow you as a third-party viewer to change and save over the original map thereby corrupting it. The original map can only be updated and changed by the account that created it. Once you click the Save icon, you’re presented with a pop-up window asking you to populate the details of your Map.
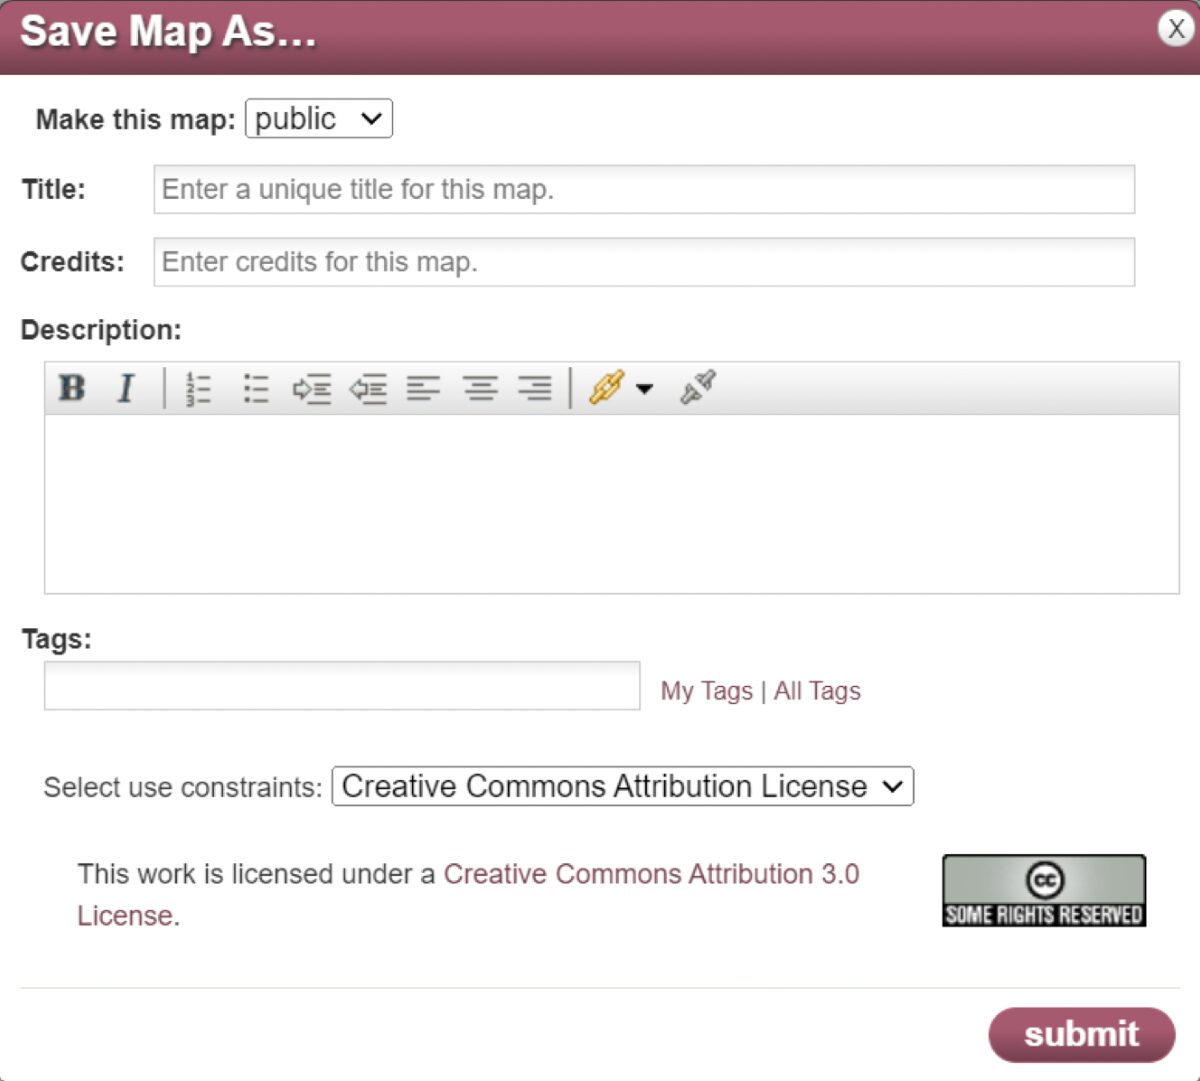
From this pop-up window, you are asked to:
- Make your copy of the map public or private (Note: If the map contains any private datasets that you have access to, you are prevented from making the map public.)
- Add a new Title for your map – you will be the owner of this version.
- Insert your name (or credit) for the map.
- Provide a description.
- Type in one or more tags to aid in searching by others.
After clicking Submit, the Map page reloads with your version of the map on-screen and automatically saves it to your private workspace map folder. That’s all there is to it.
Happy Mapping – The Data Basin Team
SUBSCRIBE TO THIS NEWSLETTER
New Data Basin YouTube Tutorial Videos
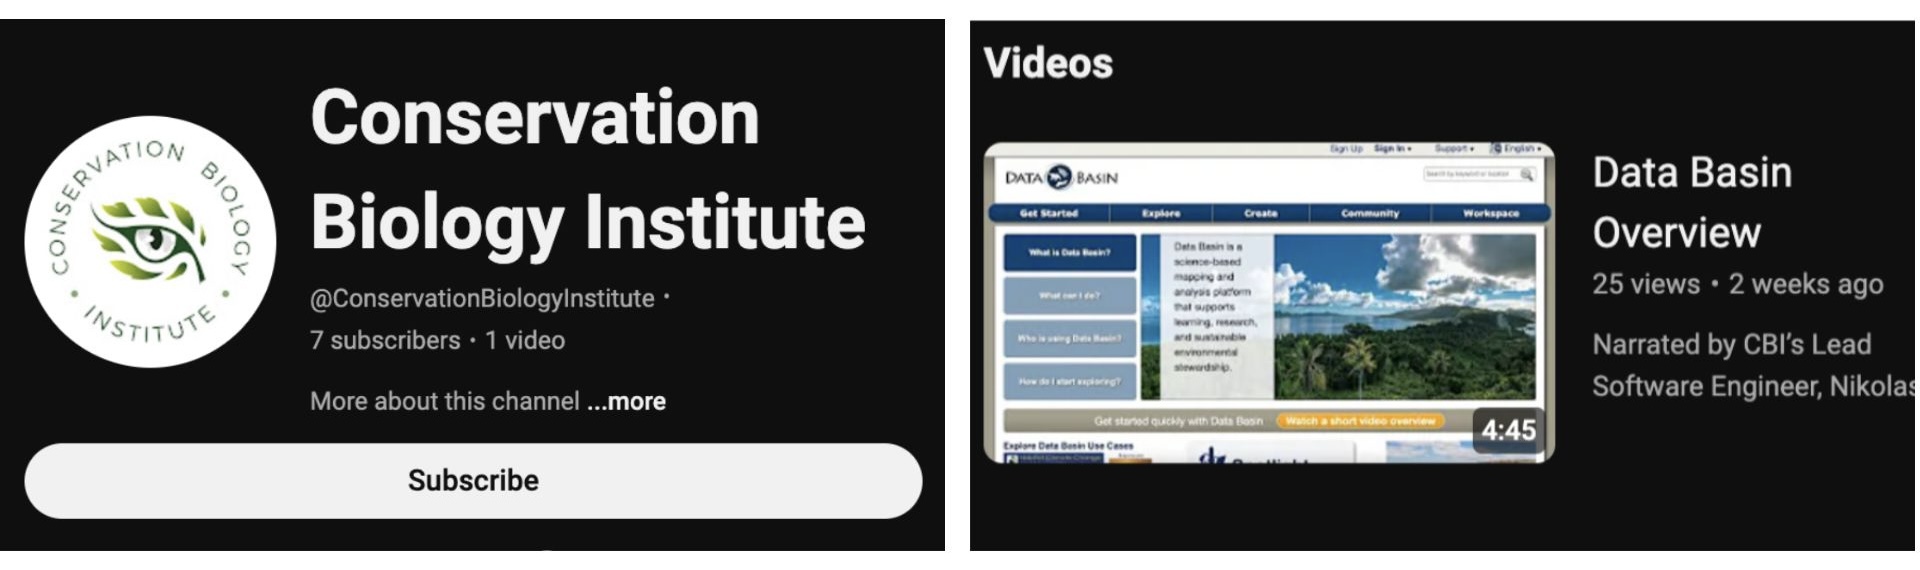
Exciting news, we’ve started our new Data Basin tutorial series! The first video, “Data Basin Overview“, explains why the platform was created, describes the main design principles, puts Data Basin in the context of other web mapping applications, and reviews how to create a free account. Subscribe to our YouTube channel to keep up on all of our new content!
Recent Wildfire and Air Quality Feeds
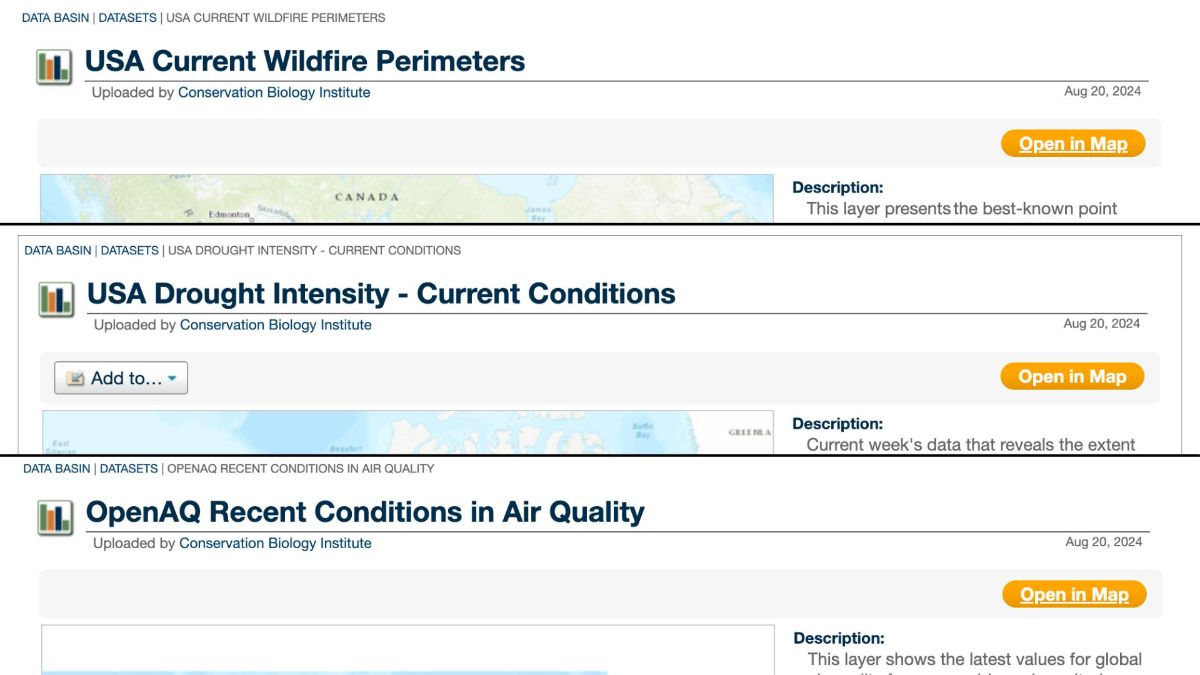
Wildfire season is in full swing in the United States! To support the mapping of current conditions, Data Basin now has three new map services you can use to access the most reliable, up-to-date data available; Wildfire Perimeters from the US Department of the Interior, Open AQ’s current air quality conditions, and current drought intensities from the National Drought Mitigation Center, University of Nebraska-Lincoln. These data are available for the conterminous United States and are updated regularly! Access these datasets anytime at Databasin.org.
Data Download vs Map Export
Datasets and Maps are similar pages within Data Basin, but each has its own Download/Export functionality. Here, we will walk through the different ways to export data and maps for multiple uses!
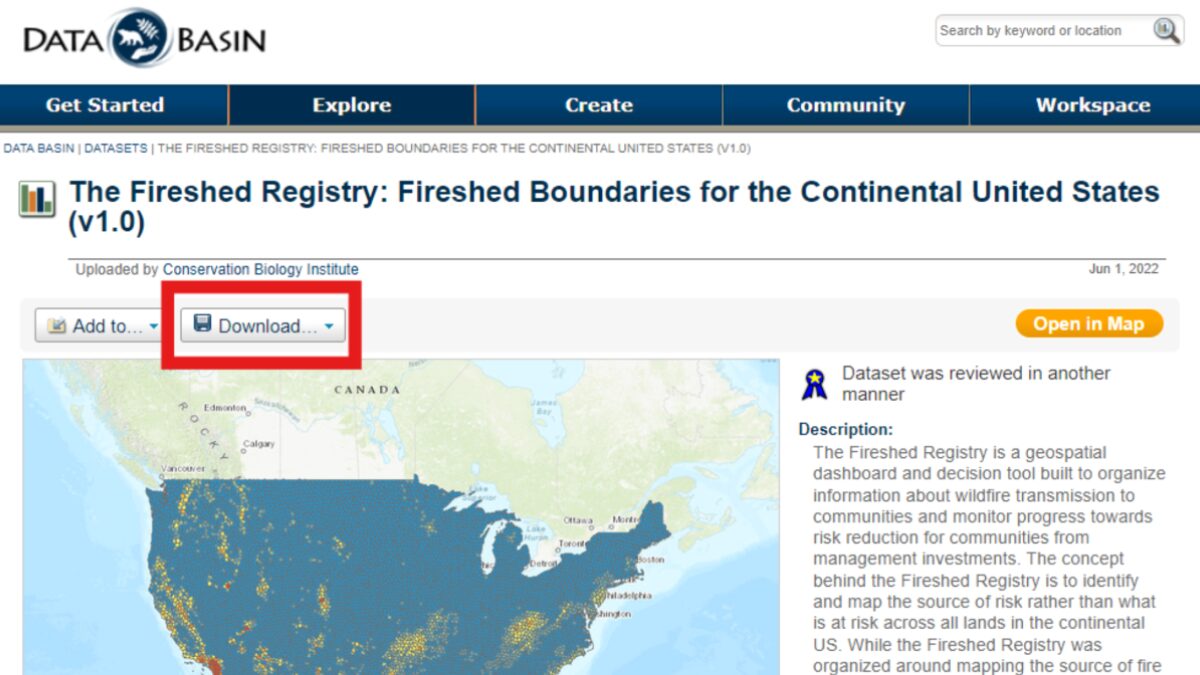
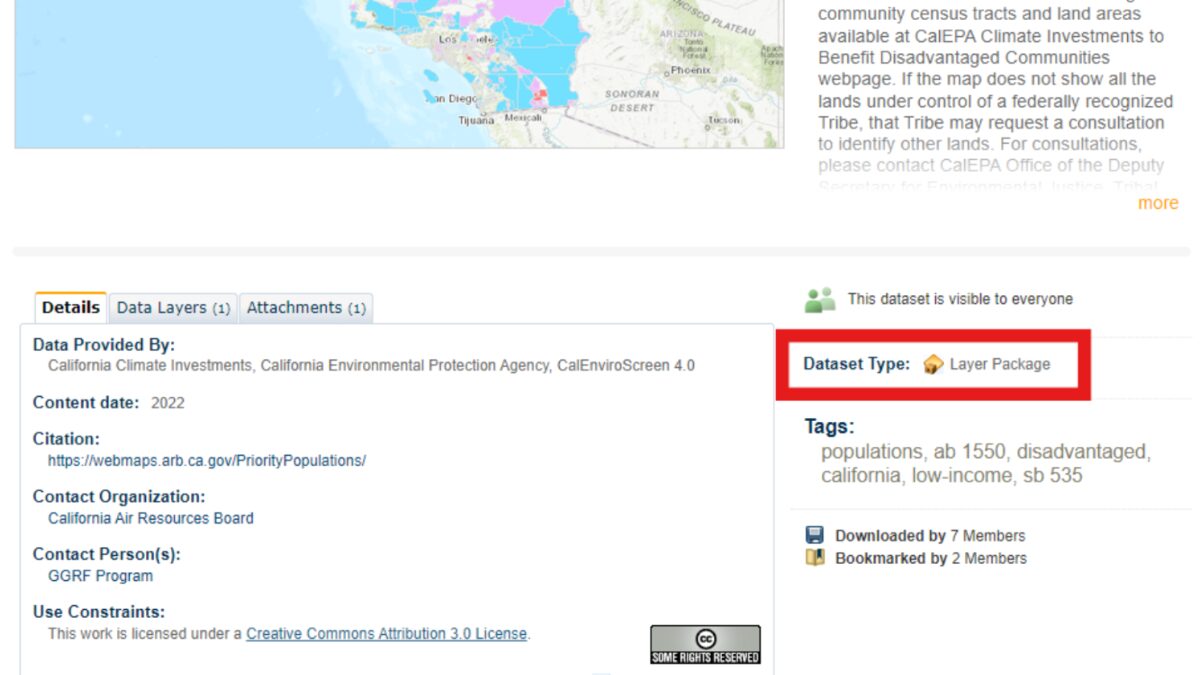
If you are looking for data to download and use for analysis in GIS software, you’ll want to Download the Dataset itself from its unique webpage. This allows you to download either an ArcGIS Layer Package or a Zip Archive of the dataset!
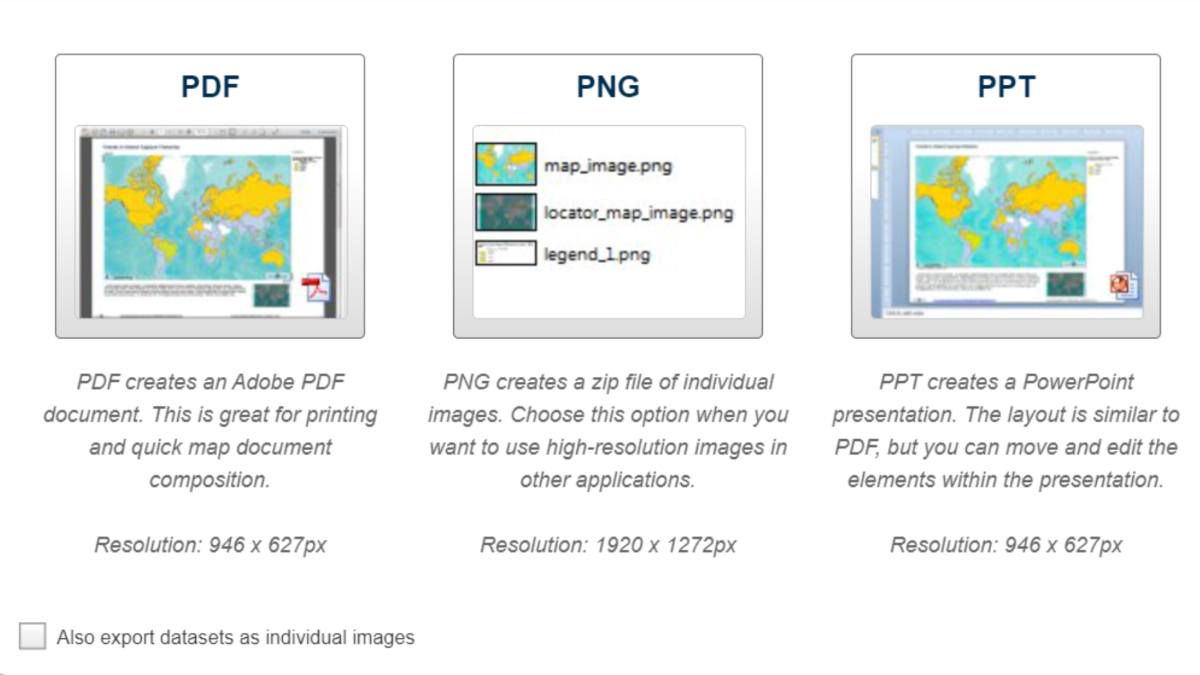
If you’re looking to download and use a Map image in your work, this can be done within the Map Interface. From here you can Export the current view in the Map to PDF, PNG, or PPT.
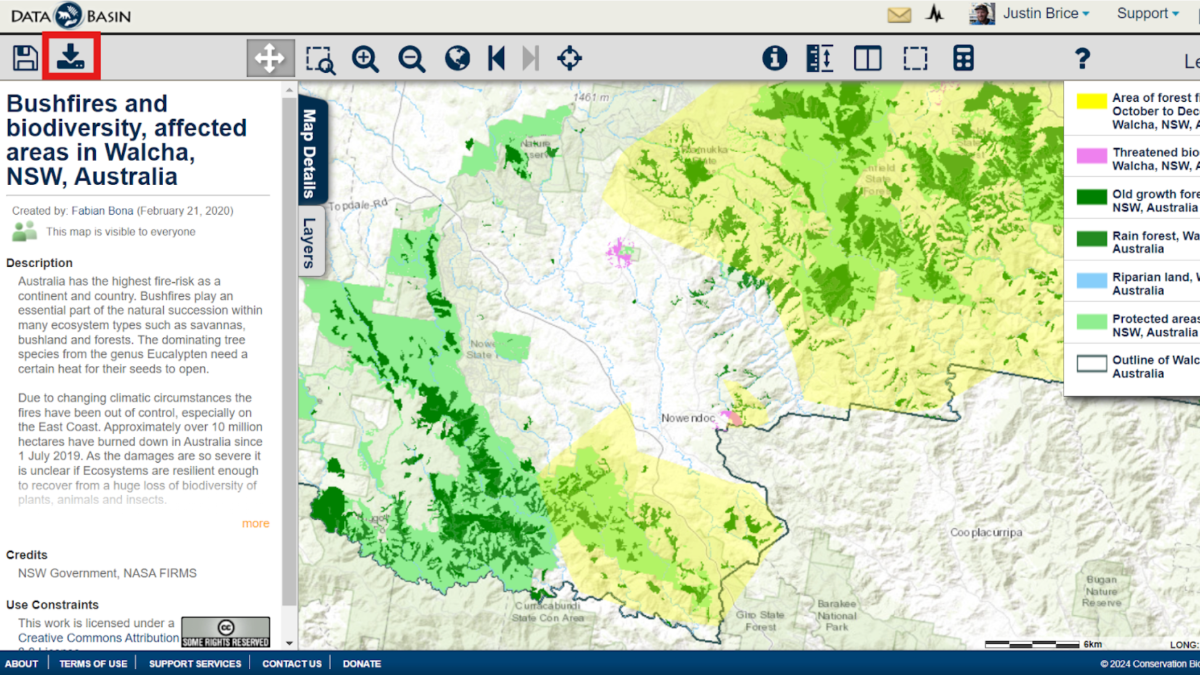
You can view the Map page by clicking on the Title of the Map (below the Download button):
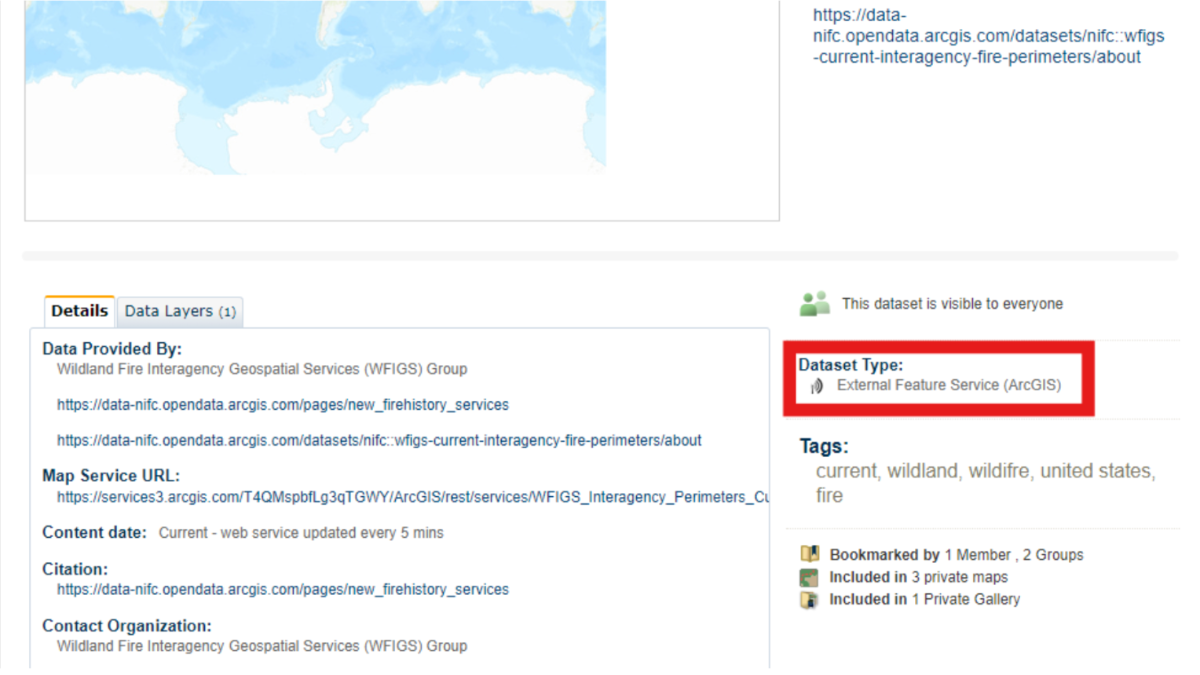
Datasets in Data Basin may be (1) uploaded data or (2) a hosted web service/feature service (external to Data Basin). Web services imported to Data Basin will reflect the hosted data and any updates made by the hosting entity (outside of Data Basin).
Users may encounter an error when trying to view a web service dataset in the Map view. Oftentimes, these issues resolve themselves if you check back a few hours later, but if you encounter a web service outage, please notify the Data Basin team so we can look into it!
When using these Data Basin products, please credit DataBasin.org, the individual data providers, and include the link to your Map that includes the Datasets and the date it was exported.
Happy Mapping!
Private Groups
Addressing diverse conservation issues sometimes requires various levels of privacy which is why there are several privacy controls within Data Basin. Currently, there are around 700 private working groups within the platform, and any member can create their own! But what are private groups used for?
On Data Basin, private groups are a great way to share, collaborate on, or securely create spatial data. These spaces allow members to control who can interact with their data and how they interact with it. Once a group has been created, group administrators have control over who can view, download, or comment on items in the group, such as datasets or maps. Below are a few examples of how private groups have been used by the Conservation Biology Institute (CBI) to promote conservation solutions around the world!
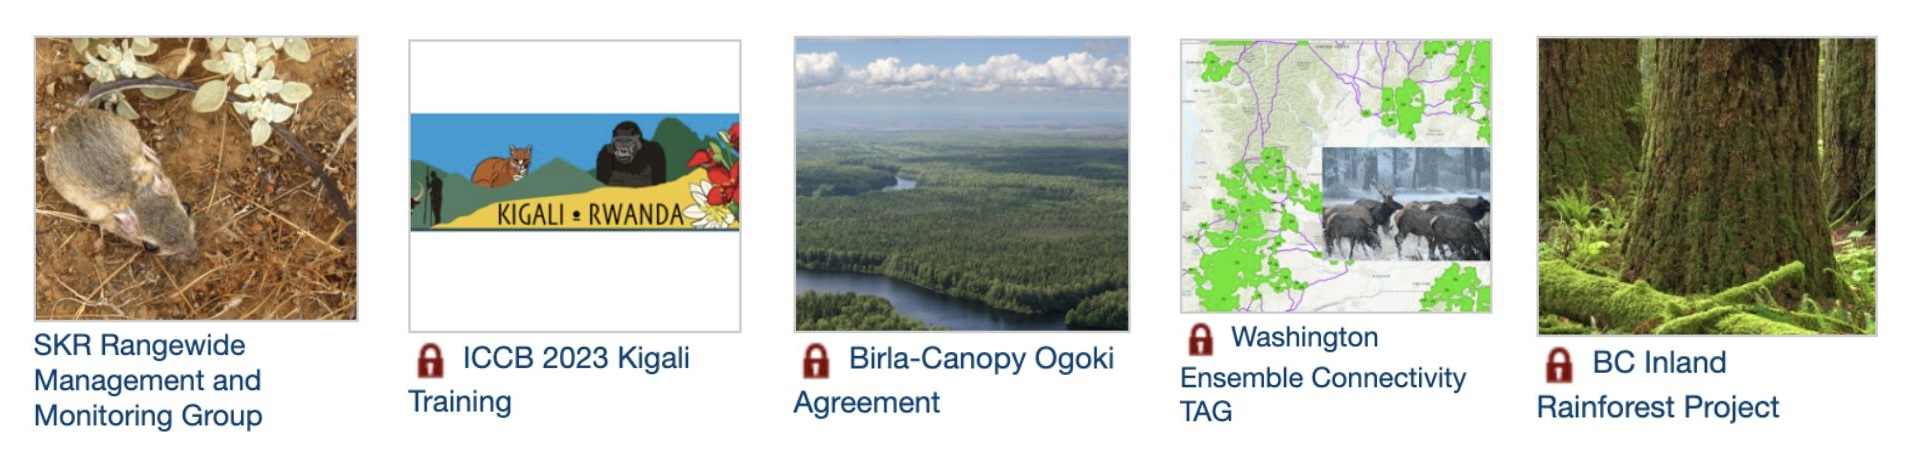
CBI has created private groups to manage sensitive monitoring programs, as is the case for a multi-agency project in southern California focused on monitoring the endangered Stephens’ Kangaroo Rat. This group has since been made public, allowing anyone to view the content! Other private groups have been created to support education and training for specific topics or regions. For example, the ICCB 2023 Kigali group was created to support sensitive data training for enrolled attendees at an internal conference in Africa. Members can also use groups to facilitate a negotiation, such as the Birla-Canopy Ogoki Agreement group, or to co-produce conservation solutions, as shown in the Washington Ensemble Connectivity TAG and the BC Inland Rainforest assessment groups, where scientists can work together in private but share results publicly.
Create Your First Map!
Once you’ve created your account, Users can Create a Map in Data Basin using existing datasets. Search among 22,000+ public datasets for data related to your question.
Some Map Tips:
- Start by searching for Datasets related to your question (wildfire, forests, wildland-urban interface, WUI, etc) Use variations of names used to broaden your Search (fire, wildfire footprints/perimeters, etc) Use location names to help narrow your search (California).
- Use the Datasets filter after your first search to narrow the results to only Datasets
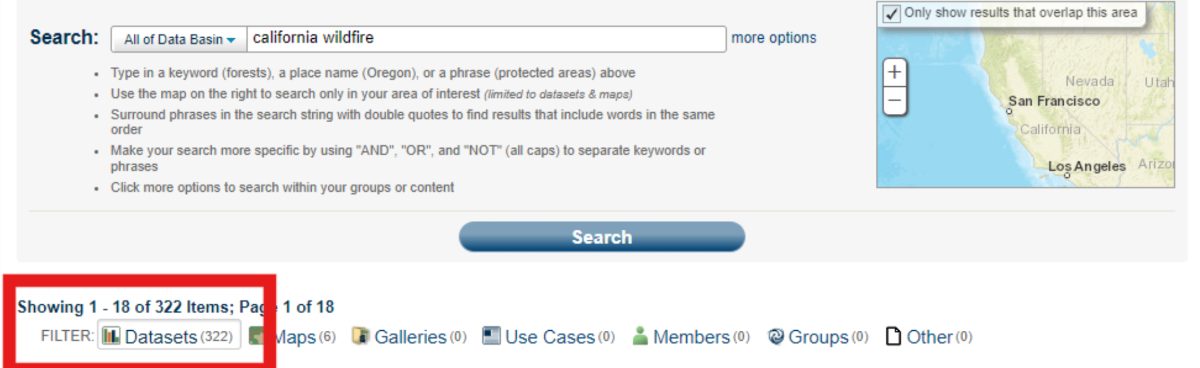
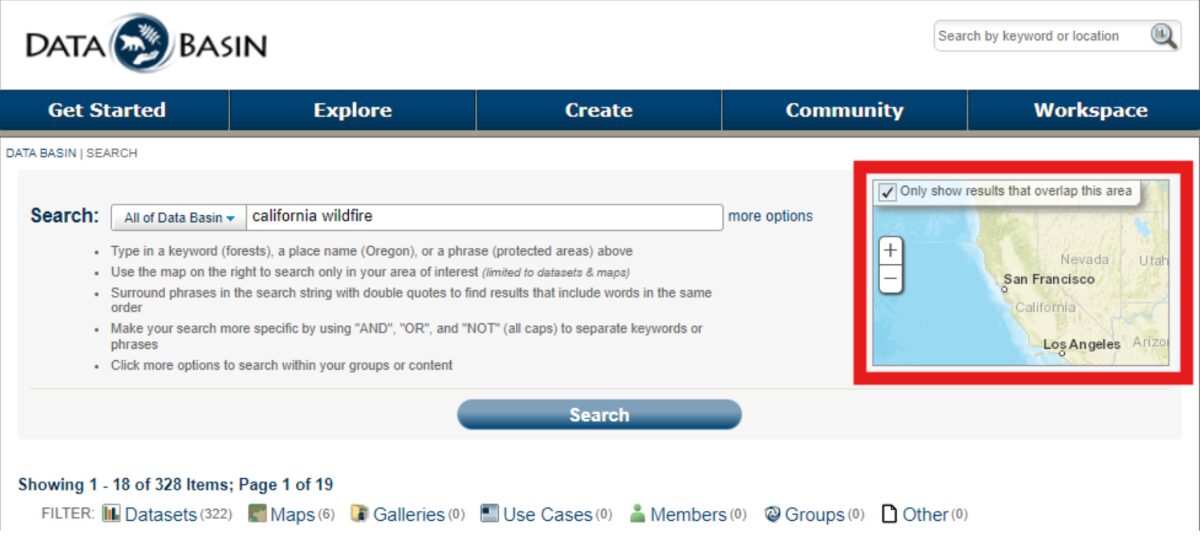
- You can limit your search results using the Map extent feature at the right of the page
- In your Search results list, click on the thumbnail image to select a Dataset.
- This opens a new toolbar, at the top of the page, with actions you can take with your selection
- You can select up to 5 Datasets to add to a new Map
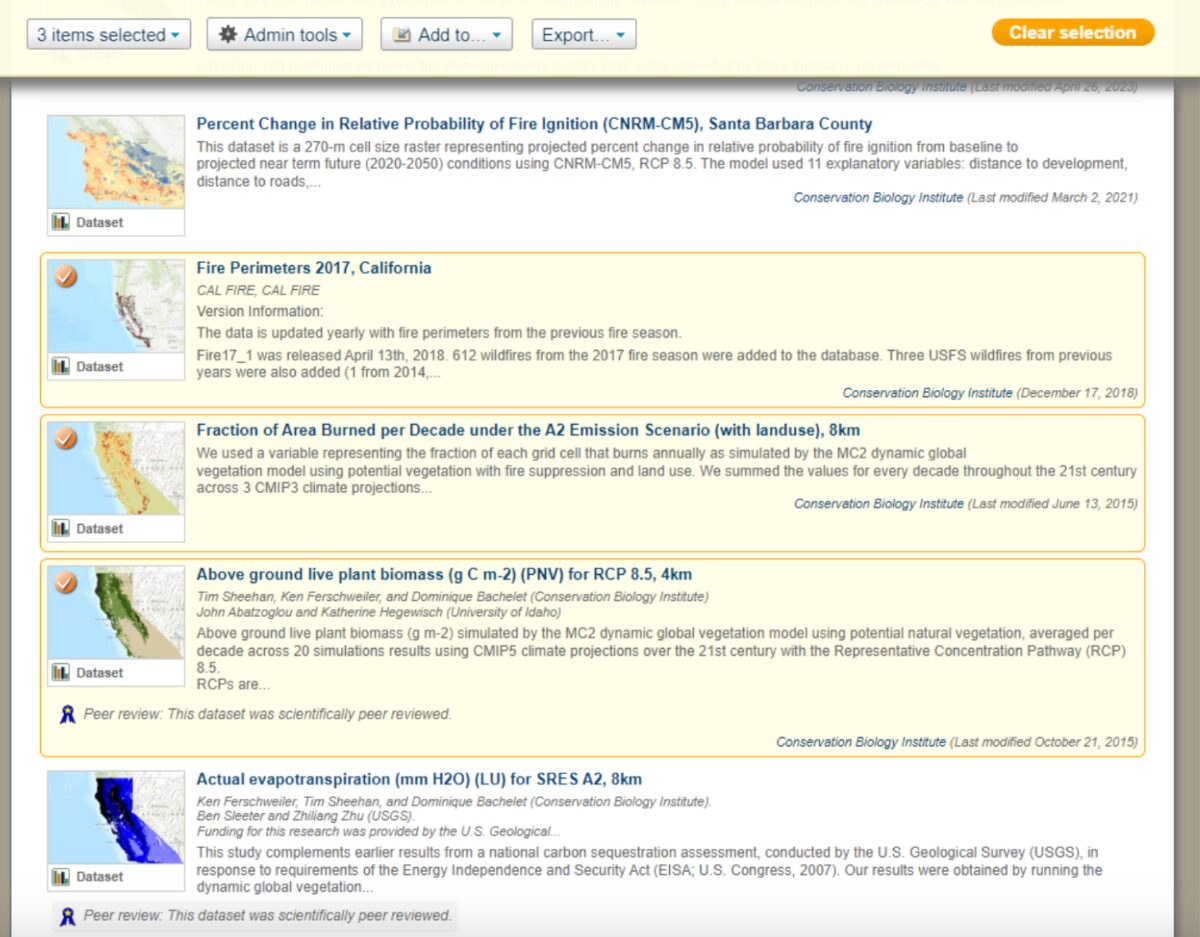
- Select “Add to”, then select “New map” to add these Datasets.
- Once they’ve loaded, save your map for future use.
Happy Mapping!
– The Data Basin Team
Data Basin Now Supports ArcGIS Pro Data Formats!
Data Basin now supports the latest version of the ESRI Layer Package format generated by ArcGIS Pro. These layer packages end with a “.lpkx” extension and can now be imported into Data Basin. Older layer packages generated by ArcGIS Desktop and ending with “.lpk” are still supported as well.
Alaska Yellow Cedar Species Conservation

Alaska Yellow Cedar (Callitropsis nootkatensis (D. Don) D.P. Little 2004; syn Xanthocyparis nootkatensis (D. Don)) has an extensive range from Alaska to Northern California. It is a very culturally significant species for North American Tribes inhabiting its range. Its long durability because of its high resistance to decay makes it a prized timber species. It is declining in the northern part of its range due to a combination of factors associated with climate change, and is a rare species in the southern part of its range in California and Southern Oregon. These southern populations are ice-age relics that occur in isolated stands in sub-alpine zones in cool wet sites at high elevation > 5000 ft. The species was recently under review for listing as a threatened or endangered species. CBI was contracted to assess the southern relic populations and collect cones for seeds in 2018 as part of a US Forest Service effort to add these germplasms to its collections.
As part of that project, we created a Data Basin Gallery for Alaska Yellow cedar to organize and share available maps and related information on its range, occurrence, modeled distribution, etc. Data Basin provides many such tools for storing, sharing, and creating maps to support the study and conservation of individual species or landscape-level habitats.
One could create individual galleries for IUCN red-listed species or any other species of significant conservation concern. These spatial data galleries can be used to support collaborative research and conservation efforts that are either global or local in scale. Sign in to Data Basin and consider creating Galleries that support your work. Please contact Justin Brice (justin.brice@consbio.org) for assistance in uploading data.
Santa Barbara County Landscape Carbon Accounting
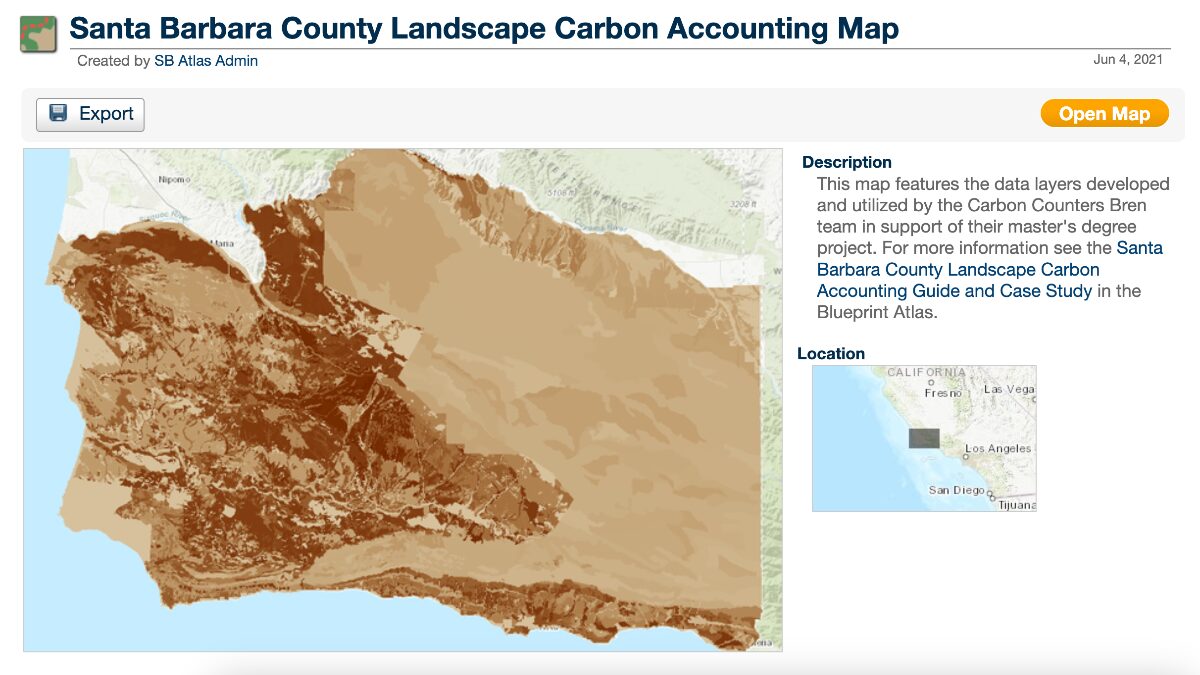
More than 85% of Santa Barbara County is covered by natural and working lands, vital to the environmental, economic, and residential well-being of the county. Natural and working lands also act as major carbon sinks but can become carbon sources depending on their management.
A group of Master’s Students from the Bren School of Environmental Studies and Management, UCSB, was able to quantify the existing carbon stocks on Santa Barbara County’s natural and working lands and was in turn able to recommend climate-smart land management practices, showing the data sources and spatial analysis that lead to their projections.
Updated Tutorial Videos Coming Soon
We are currently updating all of the Data Basin tutorial videos for our new YouTube Channel! Stay tuned as we make using Data Basin easier than ever with step-by-step guidance for users of any experience level.
Stephens’ Kangaroo Rat Rangewide Management and Monitoring Plan for Southern California

CBI’s Data Basin platform supports the Stephens’ Kangaroo Rat Rangewide Management and Monitoring Program, a collaborative effort to develop and implement a range-wide conservation plan for the Stephens’ kangaroo rat (Dipodomys stephensi, SKR), a remarkable kangaroo-like rodent endemic to southern California’s shrinking grassland habitats. Rangewide conservation actions are helping, as the SKR was recently down-listed from endangered to threatened under the US Endangered Species Act.
Data Basin’s collaborative mapping and data-sharing functions support the interdisciplinary decision-making that characterizes the effort. The SKR Team (CBI, Riverside County Habitat Conservation Agency, Bureau of Land Management, U.S. Fish and Wildlife Service, San Diego Zoo Wildlife Alliance Academy, and others) uses the SKR Rangewide Management & Monitoring Website to share the program’s key documents, population monitoring data, and conservation decisions. The Data Basin site provides interactive maps of SKR habitat quality, population distribution and abundance, conservation reserves, and other spatial data key to the team’s monitoring, research, and management actions.
Data Basin has empowered conservation practitioners and policymakers to advance the recovery of this rare and fascinating creature.
High-Resolution Map Export Option Added
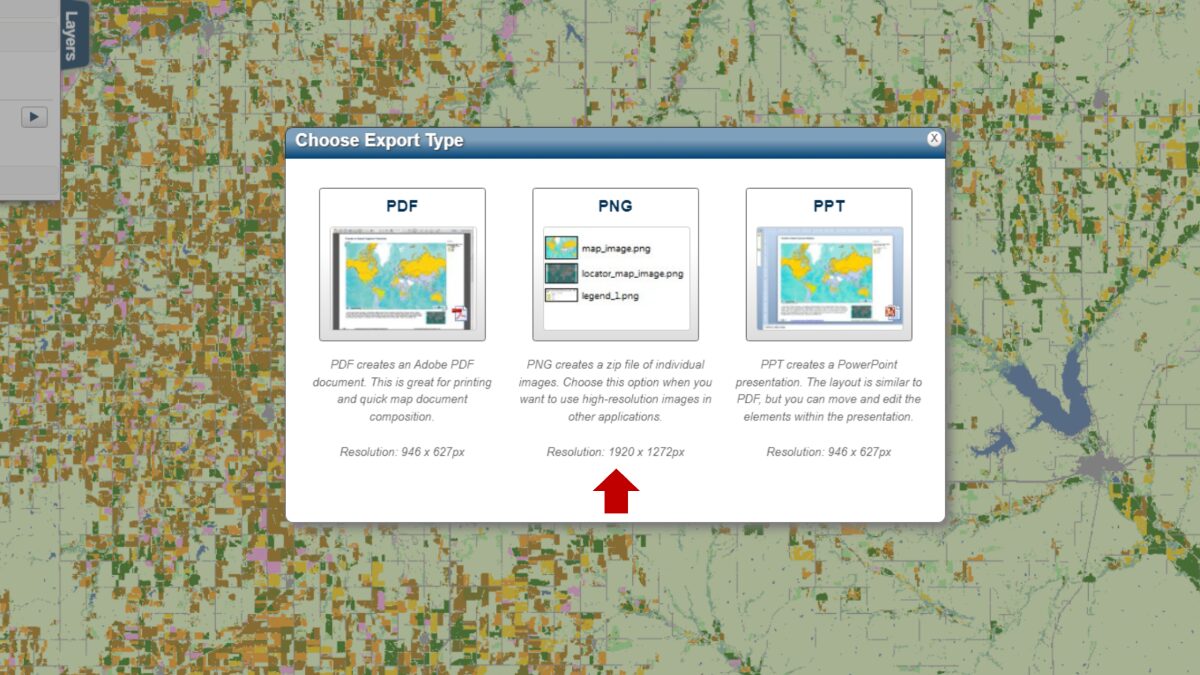
To generate sharper images (~600 dpi) of your maps, Data Basin now offers a high-resolution export option in PNG format. So, if you need a more visually crisp map for printing or publication, this is the way to go.
Dataset of the Month
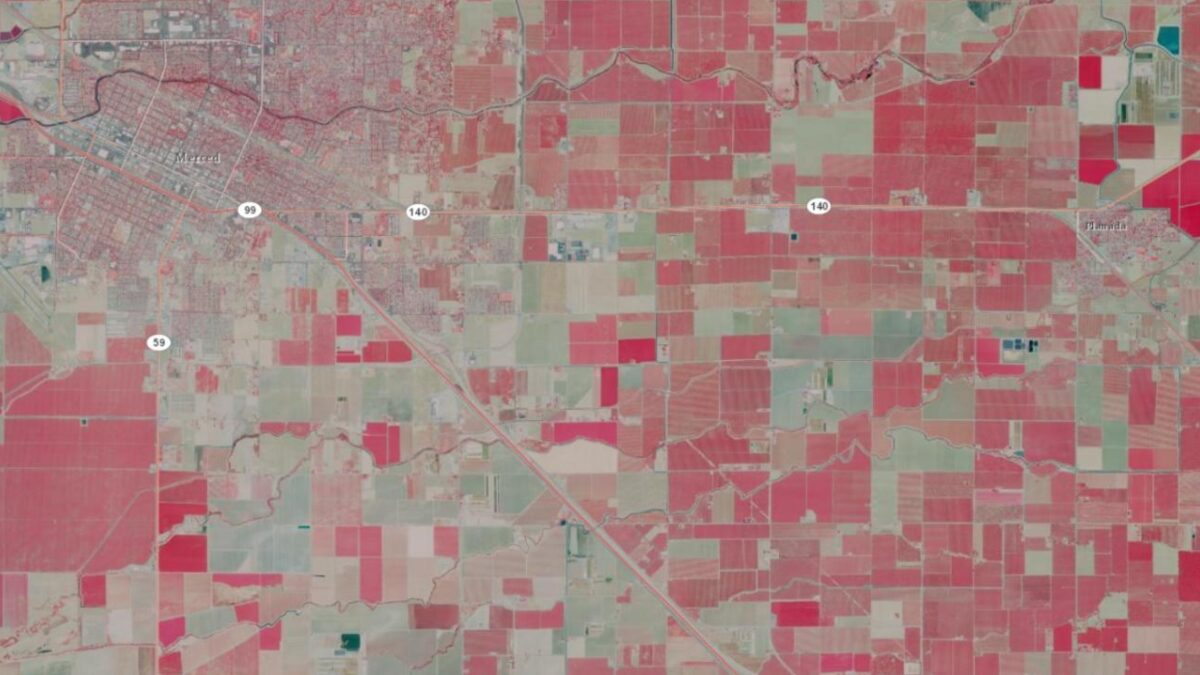
Data Basin screen capture showing the color-infrared image for the area of California between Merced and Planada. The red color depicts various intensities of agricultural crops.
Did you know you can link high-resolution airborne imagery from the National Agriculture Imagery Program (NAIP) into Data Basin? The California state composite is a compressed color-infrared image made available by the California Department of Fish and Wildlife as a map service.
Notice: The video content on our website is currently under construction, updates coming soon!
East Carolina University’s GEOG 4250/6250 Environmental Impact Analysis – Building Projects at the Data Basin “Work Bench”
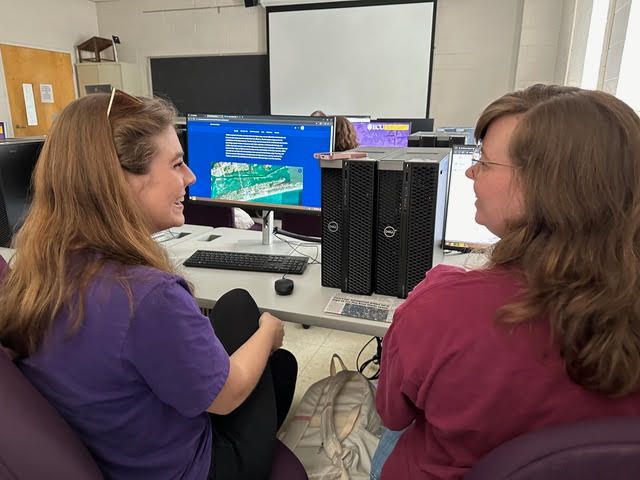
How can community-based projects be transformed into assets for real-world community stakeholders? How can student projects live well beyond the end of a semester? Dr. Laura Jean Palmer-Moloney of ECU’s Department of Geography, Planning, and Environment challenged her Environmental Impact Analysis students to find out!
Traditionally, an EIA is a structured way to think about the environment and development. It is a forward-looking instrument able to proactively advise decision-makers on what might happen if a proposed action is implemented. It has well-known steps: identify, assess, and offer ways to mitigate the potential impacts of proposed actions on human and biophysical environmental quality.
Students in GEOG 4250/6250 used geospatial tools to demonstrate ways the biophysical environmental quality in a project area might be impacted, and they took it a step further. They identified and assessed ways in which climate (e.g., hotter temperatures, sea level rise, increasing storm intensity, biodiversity loss, etc.) and anthropogenic stressors (e.g., development and land use/land cover change) may impact proposed development projects, giving the environment an active vs passive role!
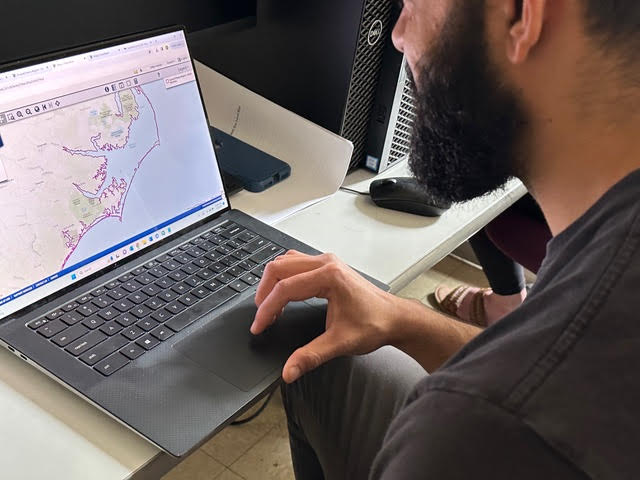
The upper-level and graduate students generated Environmental Impact Analyses of specific proposed developments in Carteret County, NC (a.k.a “the Crystal Coast”). They captured key details from the EIAs to create GEONarratives–putting content into context and making connections so that decision-makers to see consequences, potential impacts, and alternatives.
The GEONarrative is a geospatial visualization used to show key relationships and dynamics and to make the EIA report come alive. Data visualization allows the presentation of key lessons/information to clients/audiences in digestible parts. GEONarratives and EIA Decision-Steps were built and shared with community stakeholders using Conservation Biology Institute’s Data Basin.
Environmental Justice Screen
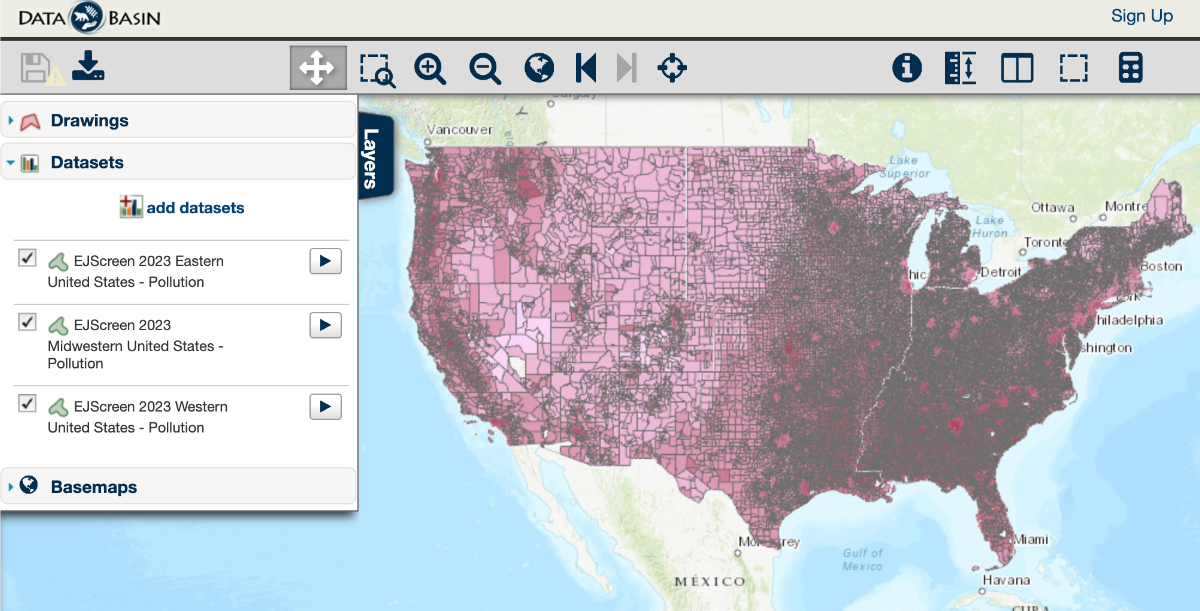
EJScreen (Environmental Justice Screen) is a map-based product published annually (2015-2023) by the U.S. Environmental Protection Agency combining demographic indicators with data on public health and the environment. These data are made available by the agency’s online tool. However, in order to make it easy for users to combine EJScreen data with other relevant datasets in Data Basin, we downloaded and processed the datasets regionally (eastern, midwestern, and western) for each of the years and split the attribute tables between population and poverty and pollution files to improve the user experience. All EJScreen datasets can be located in the Data Basin gallery called EJScreen 2015-2023.
Managing Your Data Basin Account
Not sure how to manage your Data Basin account? Don’t worry, we’re here to help!
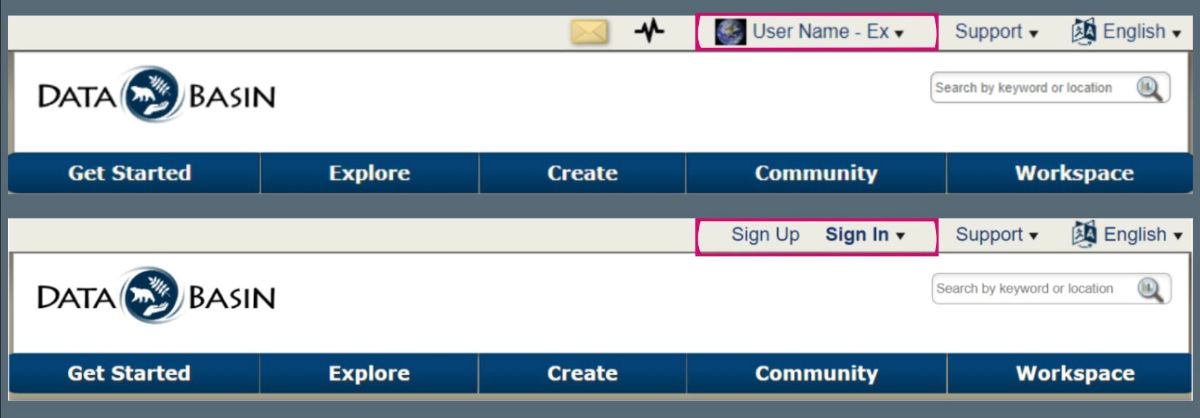
If you are logged in to Data Basin, you will see your User Name and profile image located at the top of the page. If you’re not logged in, you will see Sign Up and Sign In options.
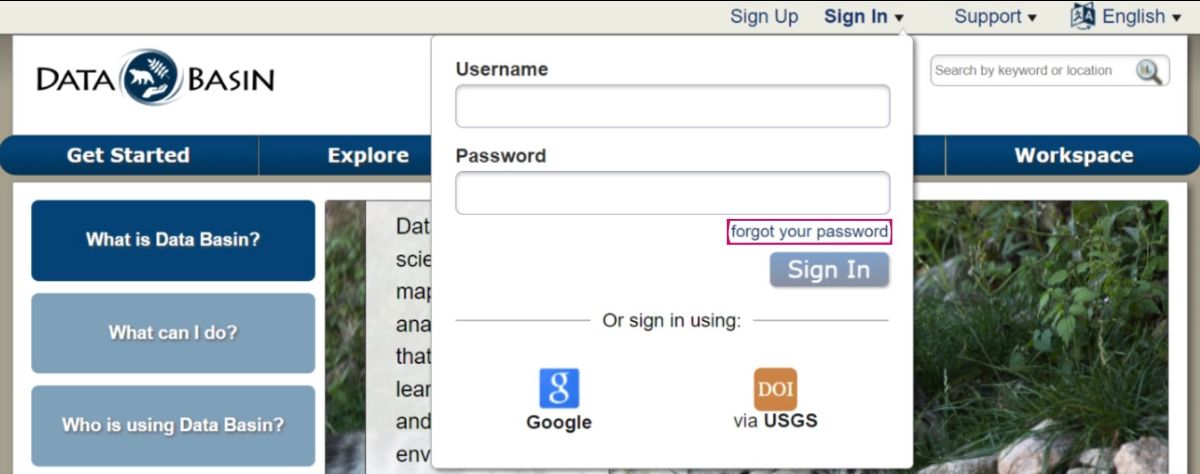
Forgot your password? That’s okay! Under the Sign In dropdown there is a forgot your password link.
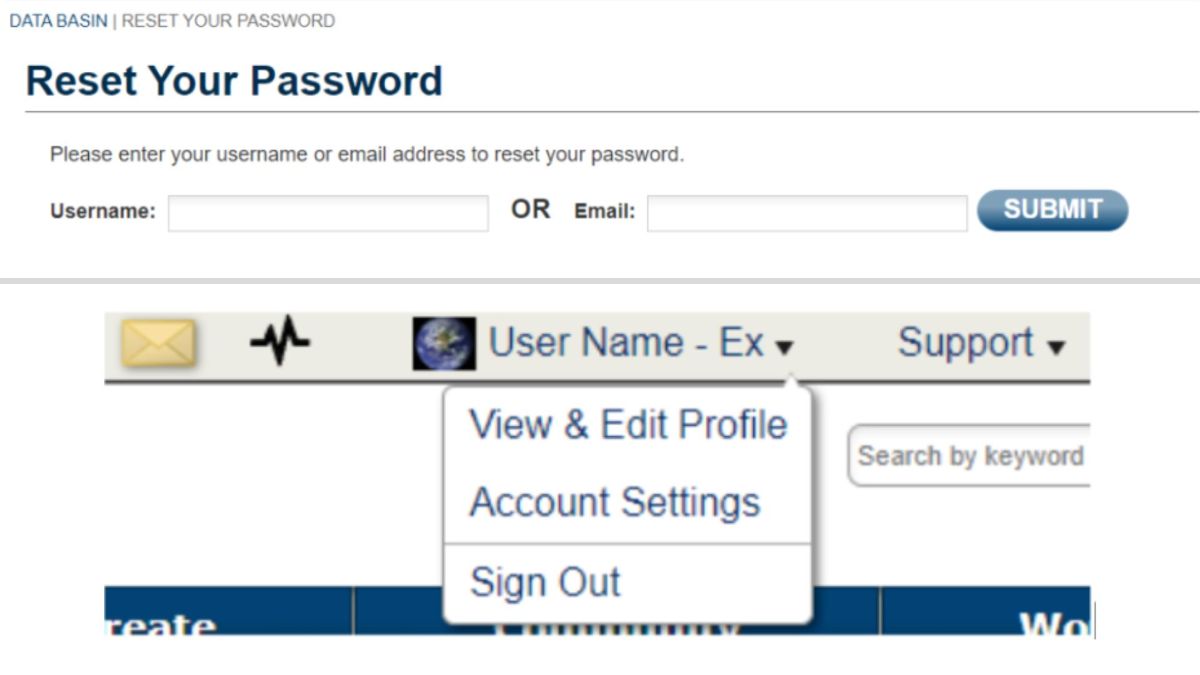
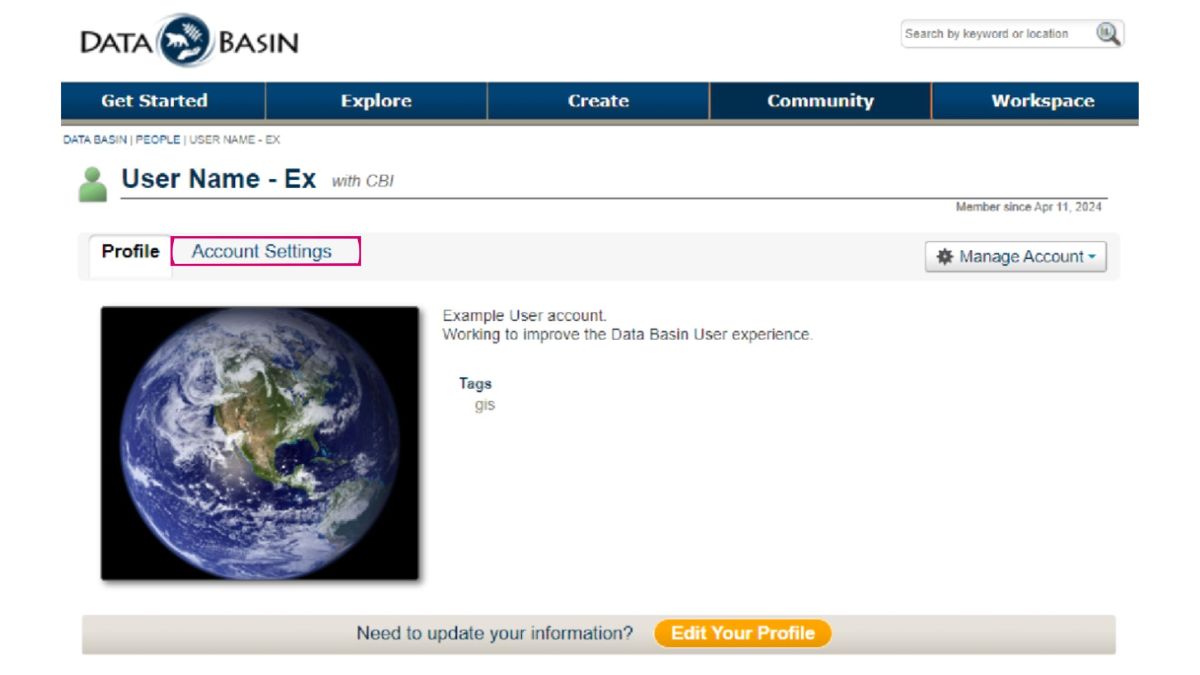
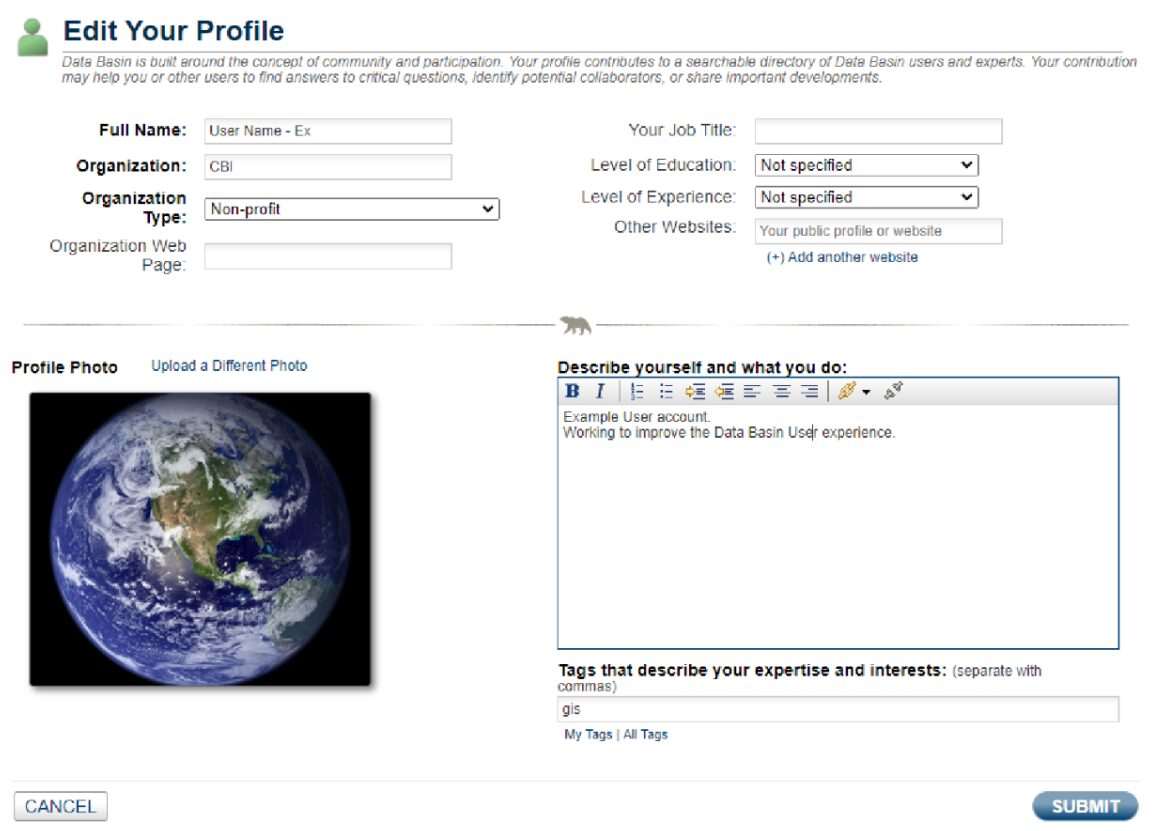
Once signed in, select your username, select View, then Edit Profile from the drop-down list. Account Settings is another option in the drop-down list and is also accessible from the Profile page.
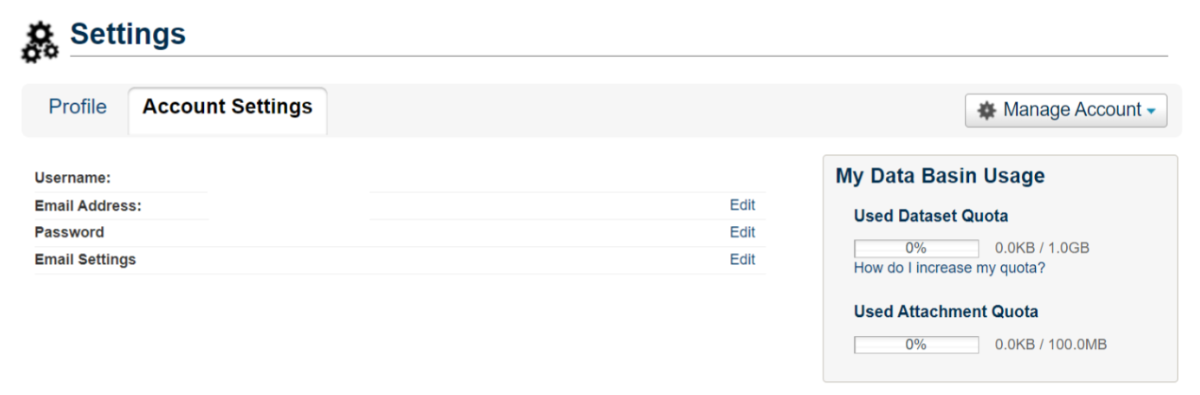
On the Account Settings page, you can edit your email address, password, and other email settings.
Email Settings include:
- Email me about news and events related to Data Basin.
- Email me when I receive a new message.
- Email mewhen someone requests to join a group I administer.
- Email me when I am added to a group.
- Email mewhen new content may need to be added to a gateway I administer.
Selecting Manage Account gives you options to Edit Profile or Delete Account. Selecting Edit Profile allows you to update and manage the details you wish to share on your profile.
If at any point you need assistance, you can connect with us using the Contact Us and Support Services links available along the bottom of any Data Basin page.
Happy Mapping!