Providing Tools for USDA Monitoring and Assessment
CBI is using the latest remote sensing, machine learning, and modeling approaches to assess the quality of grasslands and pollinator habitat. Outputs from this analysis will be delivered to USDA through an online-decision support system, designed and built by CBI, called the USDA Conservation Toolkit. This suite of map-based tools will support the USDA Conservation Reserve Program (CRP) and other land-based conservation and restoration programs operating across the United States. CRP currently covers ~24.8 million acres of working lands nationwide.
Goal: Assess ecosystems services across the CRP portfolio
- Generate products to support USDA policies and program initiatives
- Provide actionable conservation intelligence
Targets
- Quantify foundational supporting ecosystem services across CRP enrollments
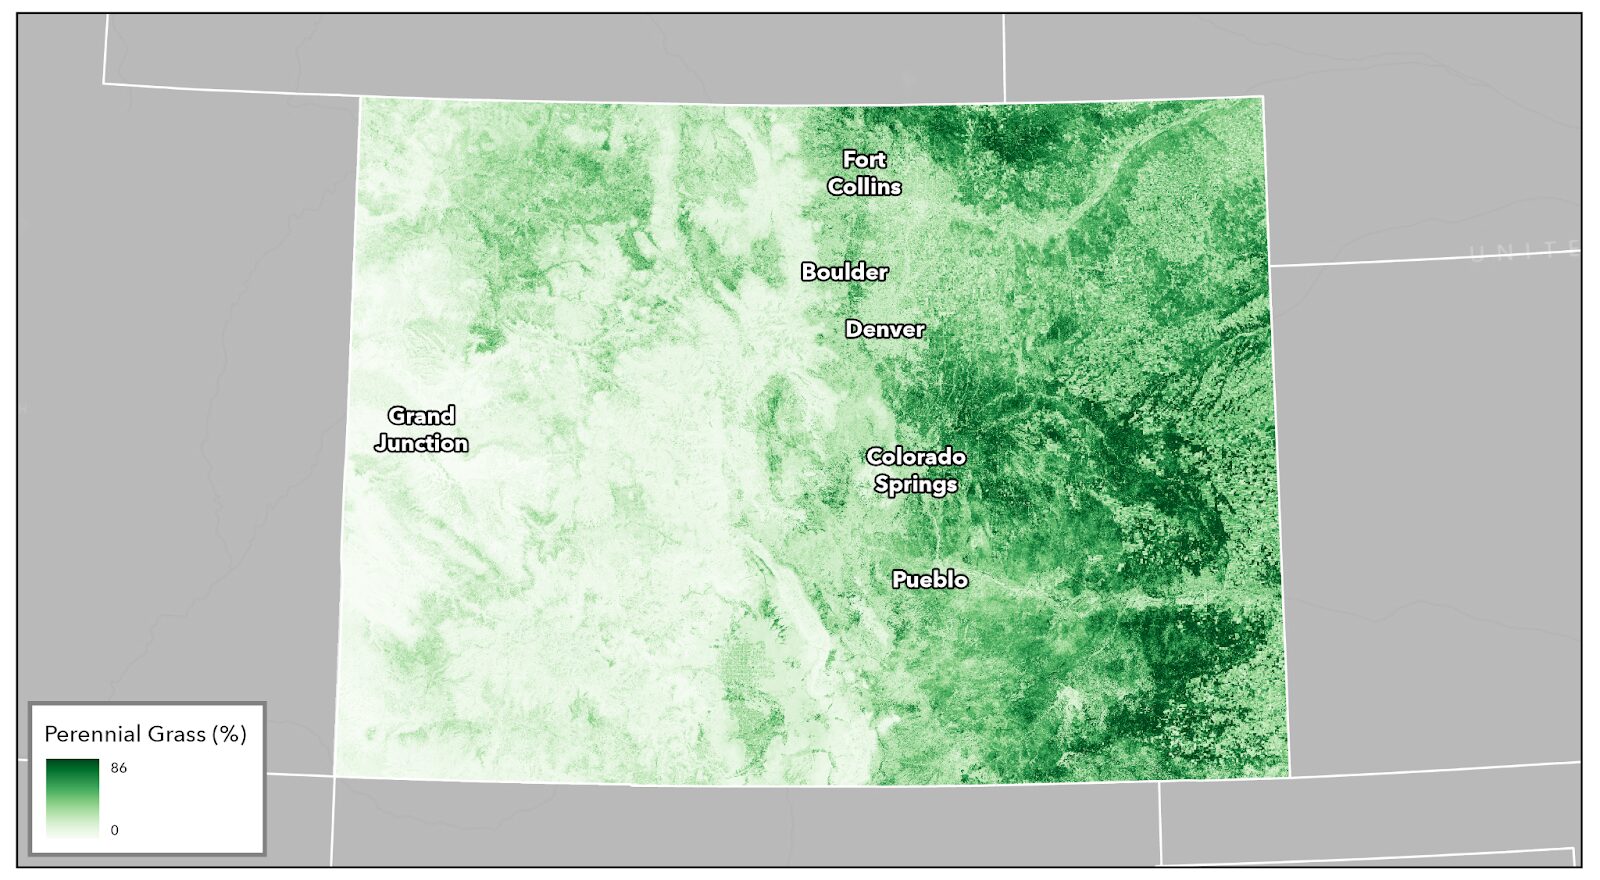
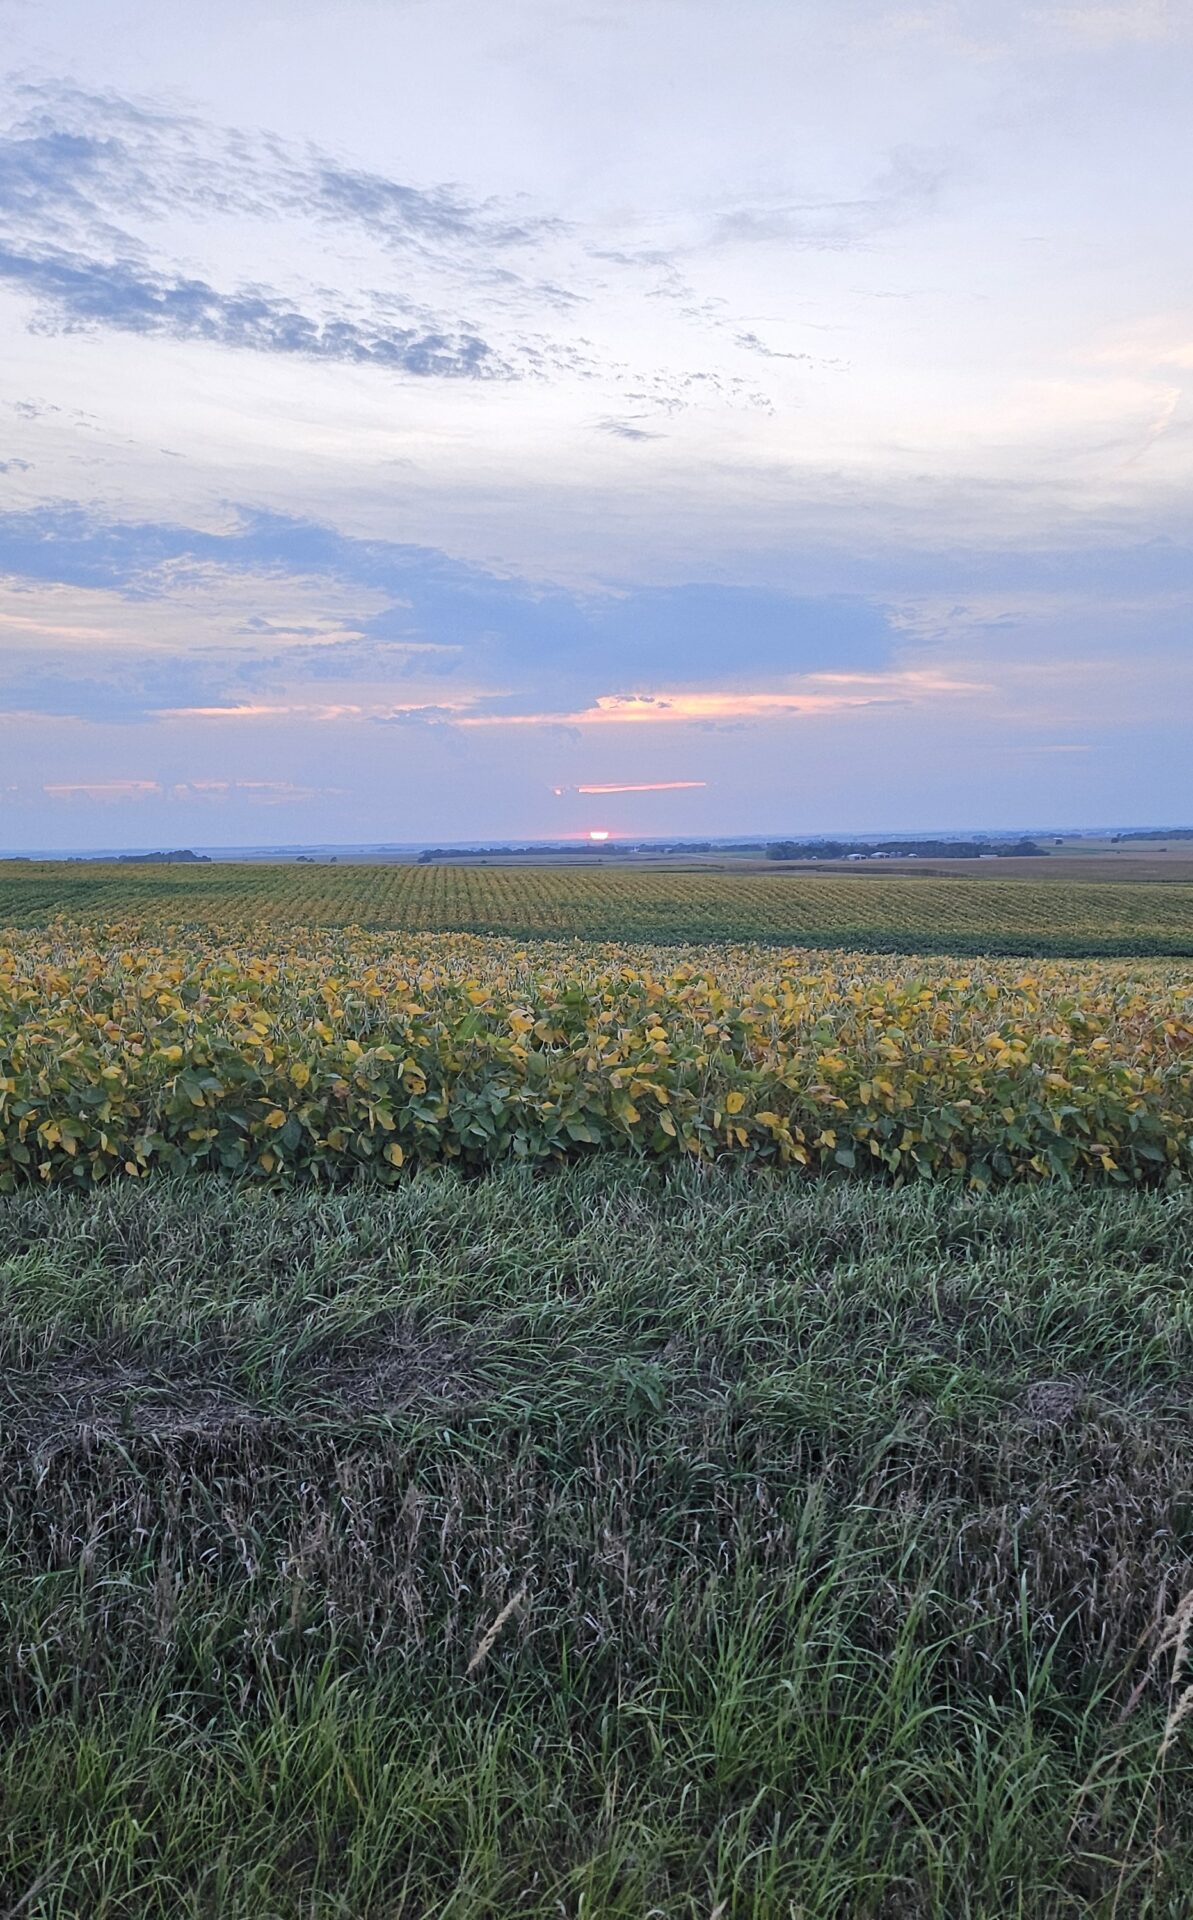
- Grasslands ecosystem quality
- Pollinator habitat quality
- Incorporate resulting spatial data and metrics into online applications, allowing for program reporting at multiple scales
- A priority for this effort is to quantify the CRP national portfolio return on investment, screening enrolled farms, and assessing at state, regional and national scales
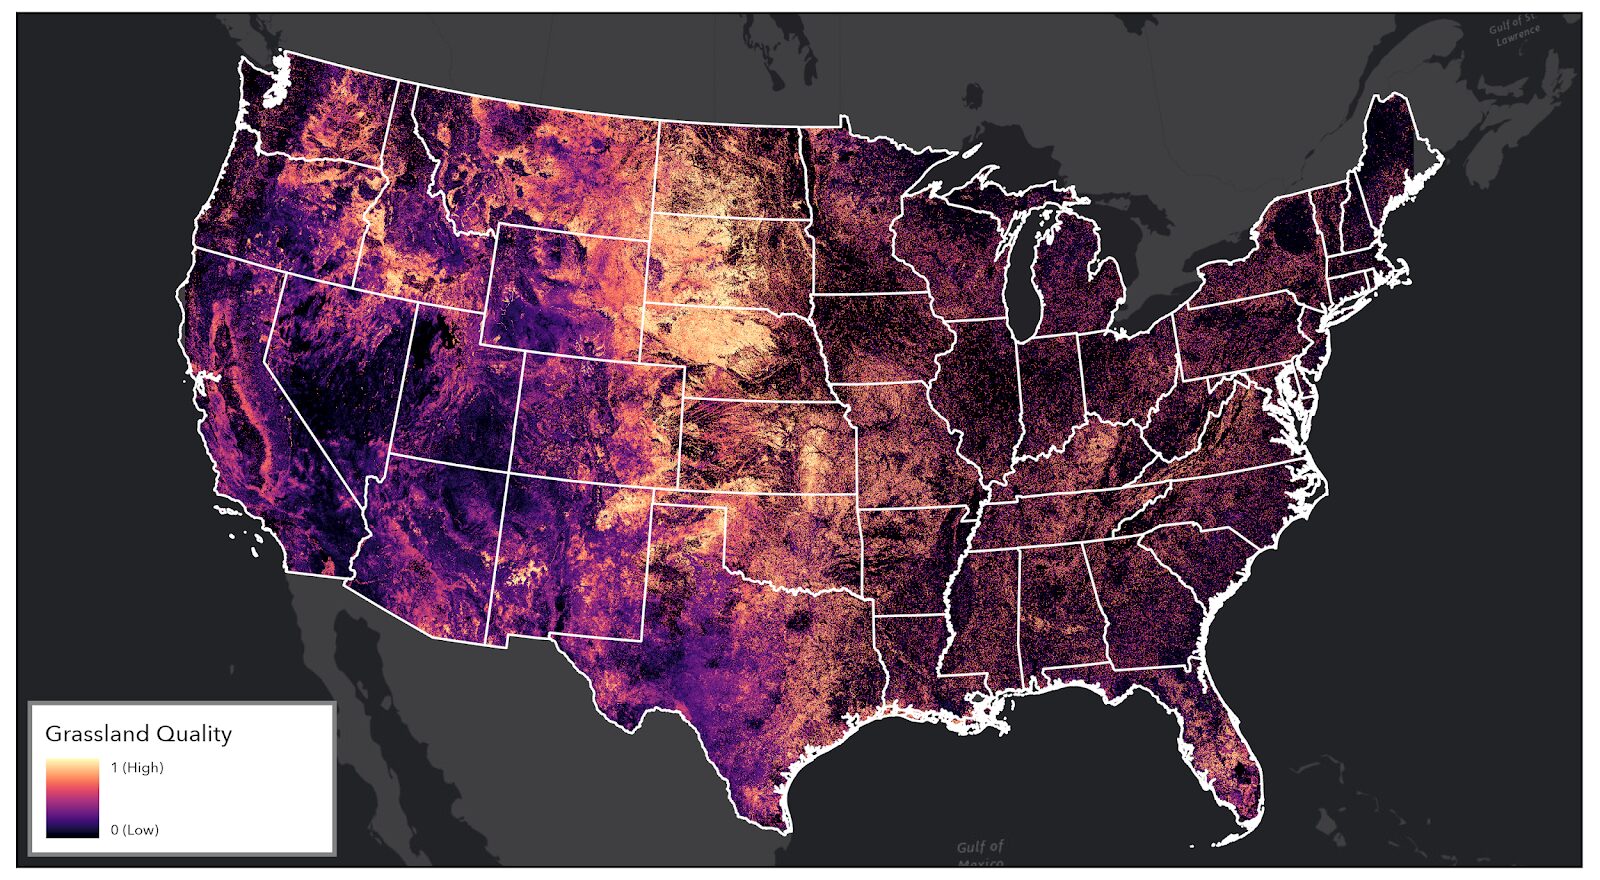
CBI CRP Grassland Quality Model – Overview
Components
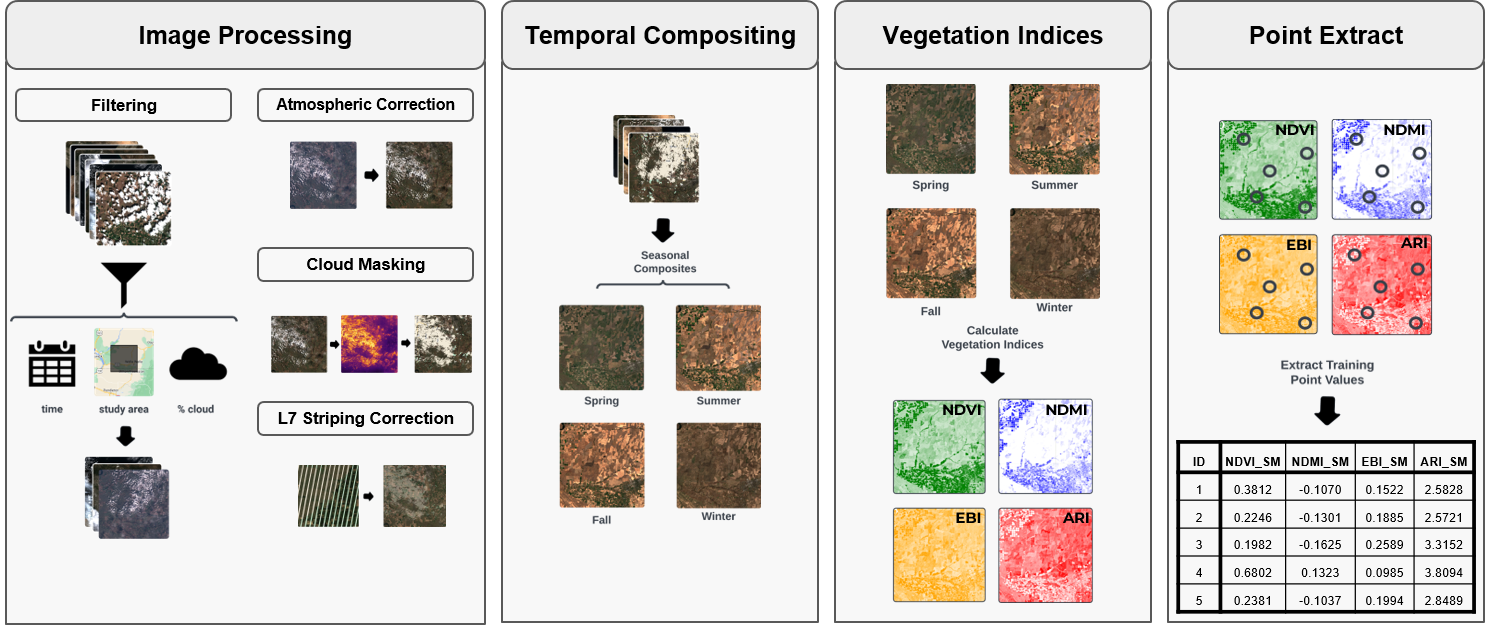
- Integrative, comprehensive approach to modeling using the best available spatial data and remotely sensed metrics (e.g. National vegetation surveys, NLCD, Rangeland Analysis Platform (RAP), custom CBI products)
- Leverages outputs from the Google Earth Engine (GEE) cloud-computing platform with CBI’s customized library of 200+ vegetation indices
What does it tell us?
- Indicator for ecosystem health, form, function, and supporting services strength, based on the USDA grassland operational definition (USDA-NRCS 2024, National Resources Inventory Grazing Land On-Site Data Collection Handbook)
- Complements existing frameworks (Rangeland Health Assessment) and other modeling efforts (RAP, K. Barnes 2024)
What does it offer USDA?
- Multi-scale (non-monetary), valuation of ecosystem condition for CRP enrolled lands and surrounding landscape
- Insights on baseline field-level condition and landscape-level spatial analytics for CRP assessment and reporting
- Illustrates CRP return on investment at a programmatic scale and quantifies enrolled land performance with nuanced metrics
How is it unique?
- Hierarchical measure of grassland ecosystem vigor, community composition, and resilience
- Expandable framework produces multidimensional metrics to quantify patterns across the landscape
- Summarizes information across CRP farms and practices
- Offers insights on baseline current state and local condition at multiple scales
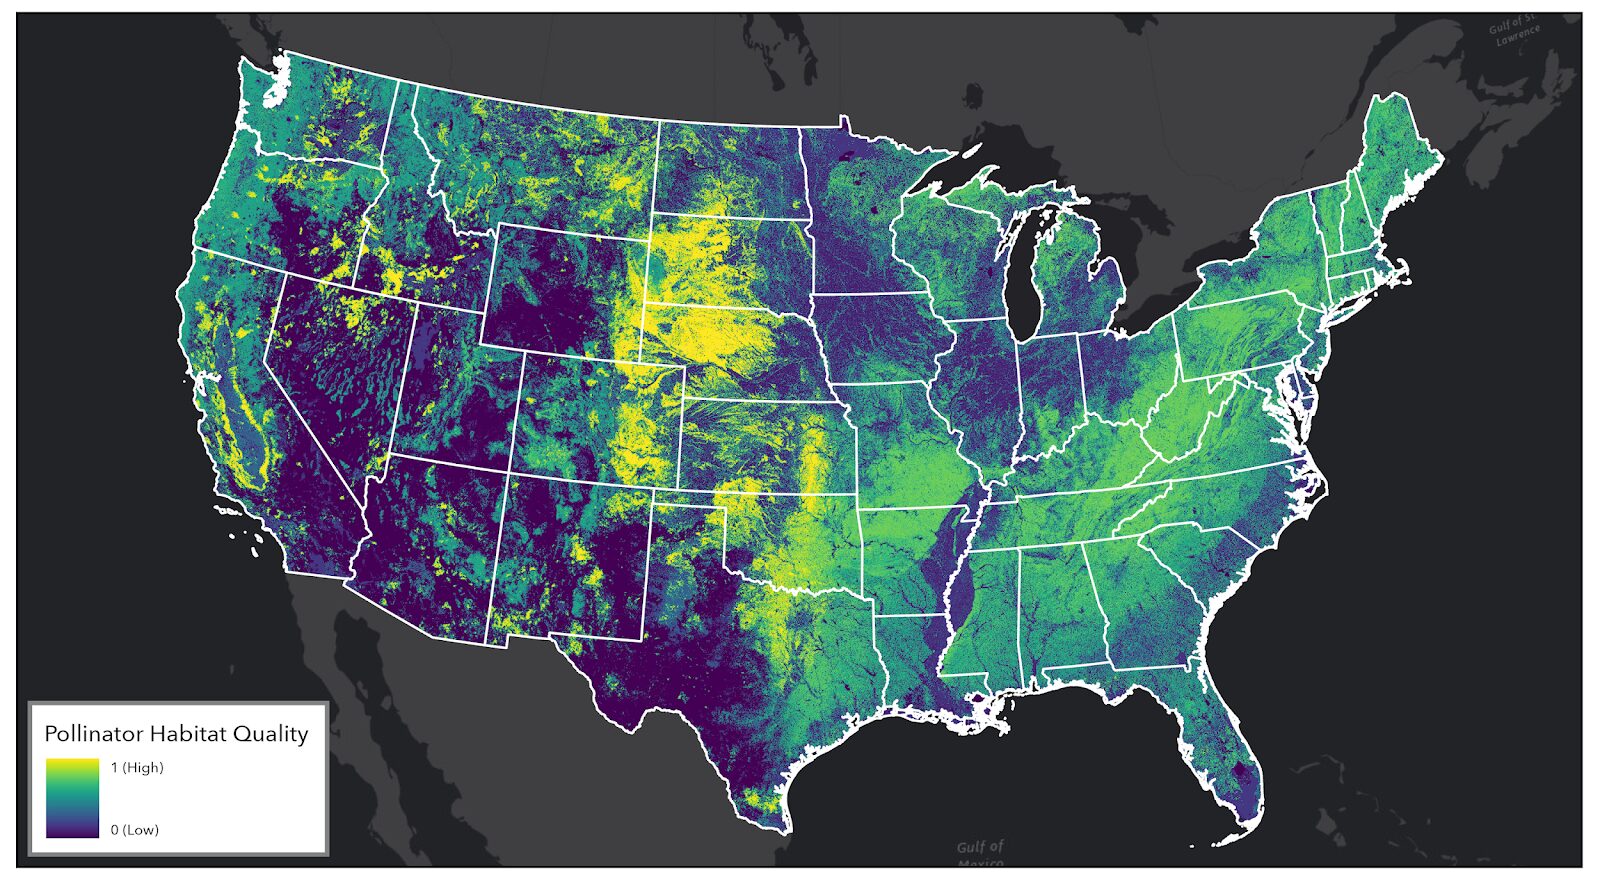
Pollinator Habitat Quality Model – Overview
Components
- Integrative, comprehensive approach to modeling using the best available spatial data and remotely sensed metrics (e.g. US National Phenology Network, NLCD, Rangeland Analysis Platform (RAP), NatureServe Explorer, custom CBI products)
What does it tell us?
- Describes pollinator natural resource needs and spatial use of the landscape
- Indicator for pollinator population health and pollination service strength
- Spatial complement to on-ground pollinator assessments funded by USDA
What does it offer USDA?
- Multi-dimensional, non-monetary valuation of pollinator habitat
- Foundation for field to landscape-level spatial analytics for CRP assessment and reporting
- Illustrates CRP return on investment at a programmatic scale and quantifies enrolled land performance with nuanced metrics
How is it unique?
- Builds on the benchmark InVest© model framework
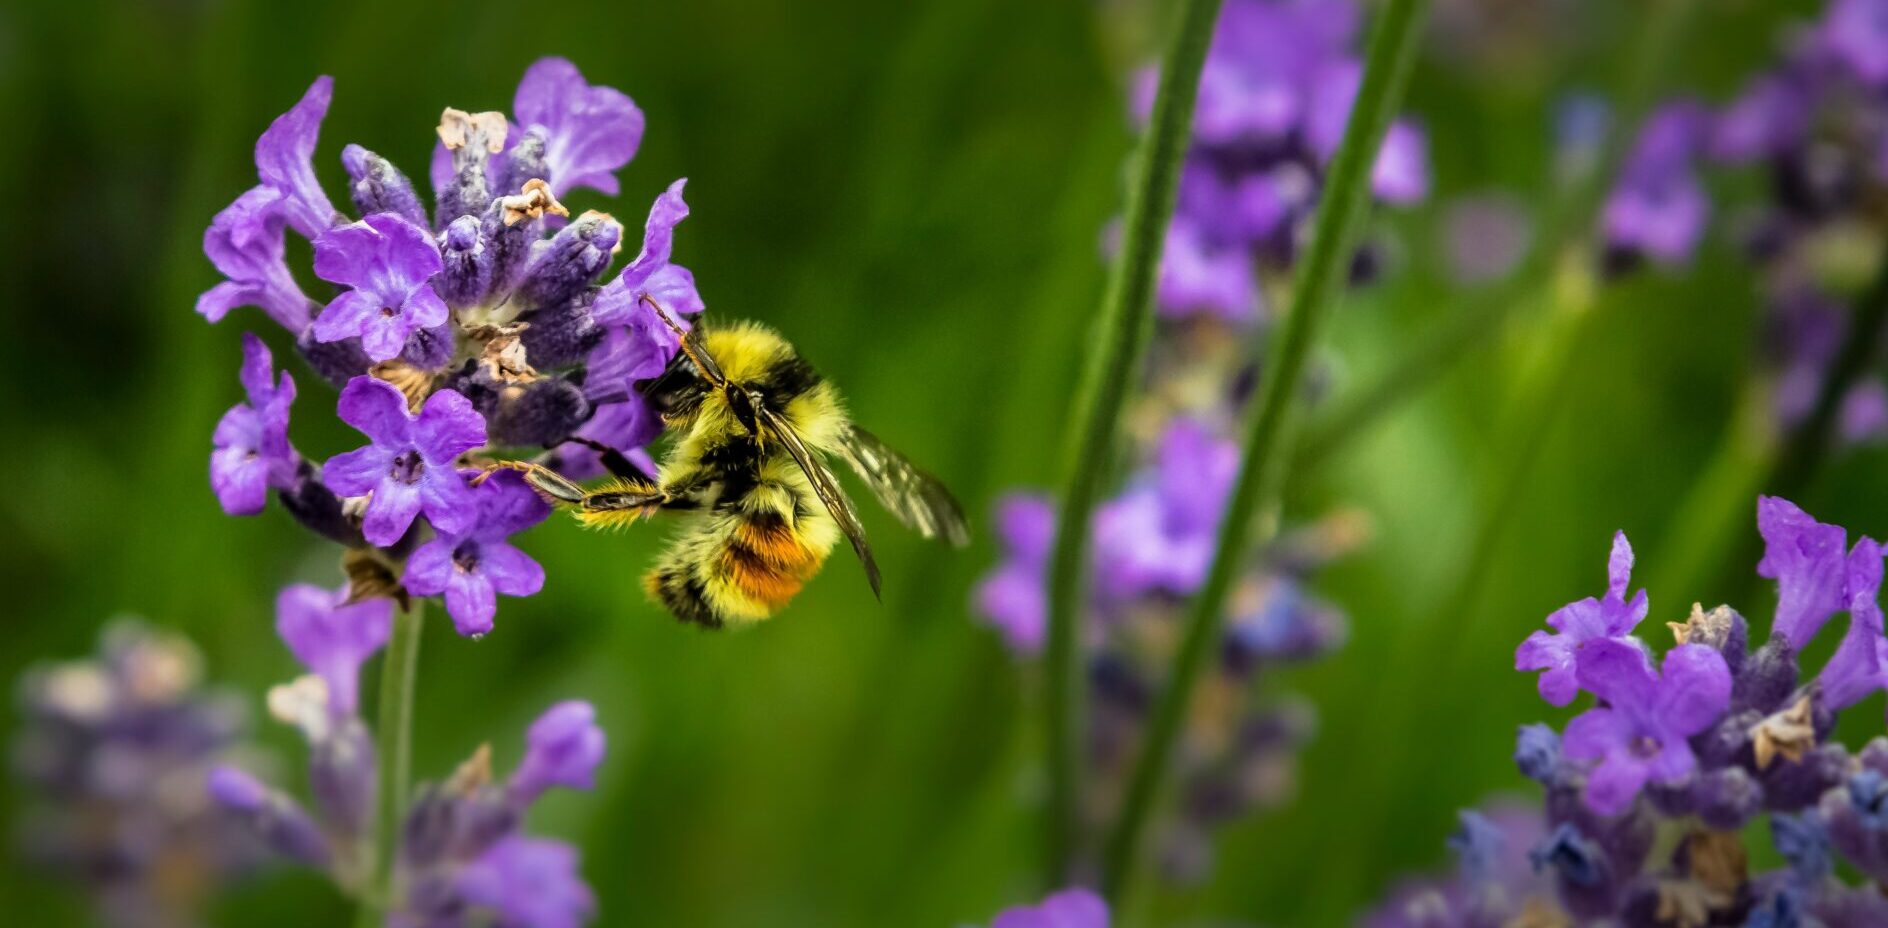
- Informed by 300,000 bee observations from the Global Biodiversity Information Facility (GBIF)
- Innovations for bee flight, nesting, and floral suitability estimates
Project Details
Partner
Location
Date
Services Provided

Conservation Planning & Management

Scientific Research & Modeling

Spatial Analysis & Mapping